PJT Partners Investment Banking Pitch Book
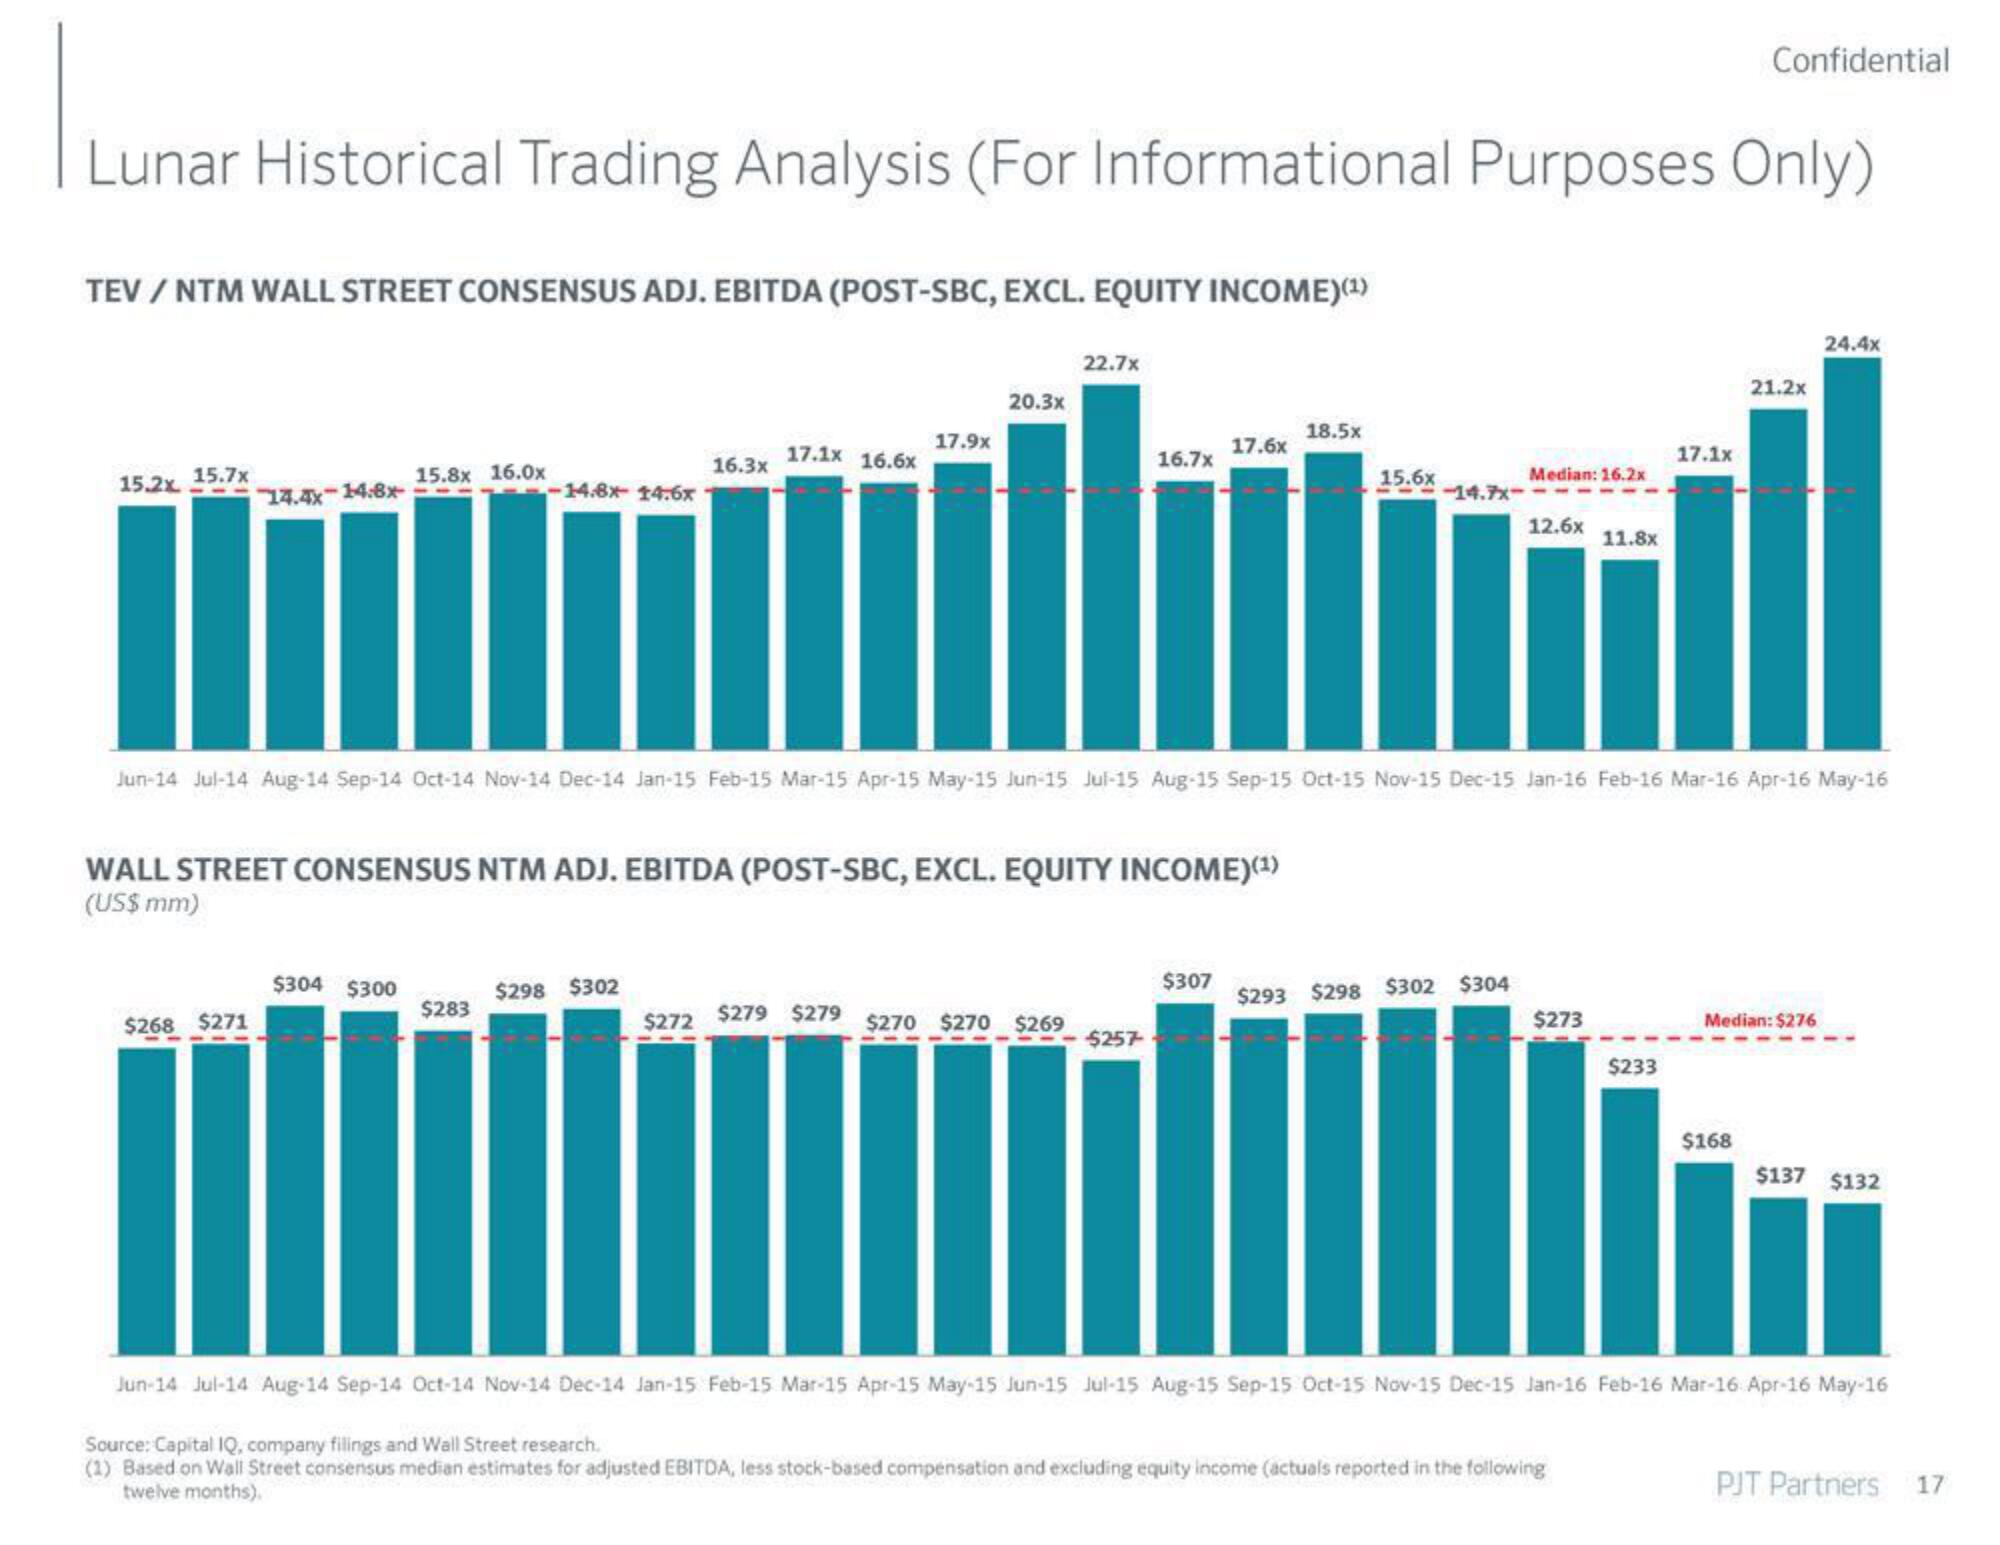
Lunar Historical Trading Analysis (For Informational Purposes Only)
TEV / NTM WALL STREET CONSENSUS ADJ. EBITDA (POST-SBC, EXCL. EQUITY INCOME)(¹)
15.2x
15.7x
14.4x-14.8x
$268 $271
15.8x 16.0x
$304 $300
-14.8x 14.6x
$283
16.3x
17.1x 16.6x
$298 $302
17.9x
20.3x
WALL STREET CONSENSUS NTM ADJ. EBITDA (POST-SBC, EXCL. EQUITY INCOME)(¹)
(US$ mm)
$272 $279 $279
22.7x
$270 $270 $269
16.7x
$257-
17.6x
$307
18.5x
15.6x
Jun-14 Jul-14 Aug-14 Sep-14 Oct-14 Nov-14 Dec-14 Jan-15 Feb-15 Mar-15 Apr-15 May-15 Jun-15 Jul-15 Aug-15 Sep-15 Oct-15 Nov-15 Dec-15 Jan-16 Feb-16 Mar-16 Apr-16 May-16
-14.7x-
Median: 16.2x
$293 $298 $302 $304
12.6x
11.8x
$273
17.1x
$233
Confidential
21.2x
$168
Median: $276
24.4x
$137 $132
Jun-14 Jul-14 Aug-14 Sep-14 Oct-14 Nov-14 Dec-14 Jan-15 Feb-15 Mar-15 Apr-15 May-15 Jun-15 Jul-15 Aug-15 Sep-15 Oct-15 Nov-15 Dec-15 Jan-16 Feb-16 Mar-16. Apr-16 May-16
Source: Capital IQ, company filings and Wall Street research.
(1) Based on Wall Street consensus median estimates for adjusted EBITDA, less stock-based compensation and excluding equity income (actuals reported in the following
twelve months).
PJT Partners
17View entire presentation