Cboe Results Presentation Deck
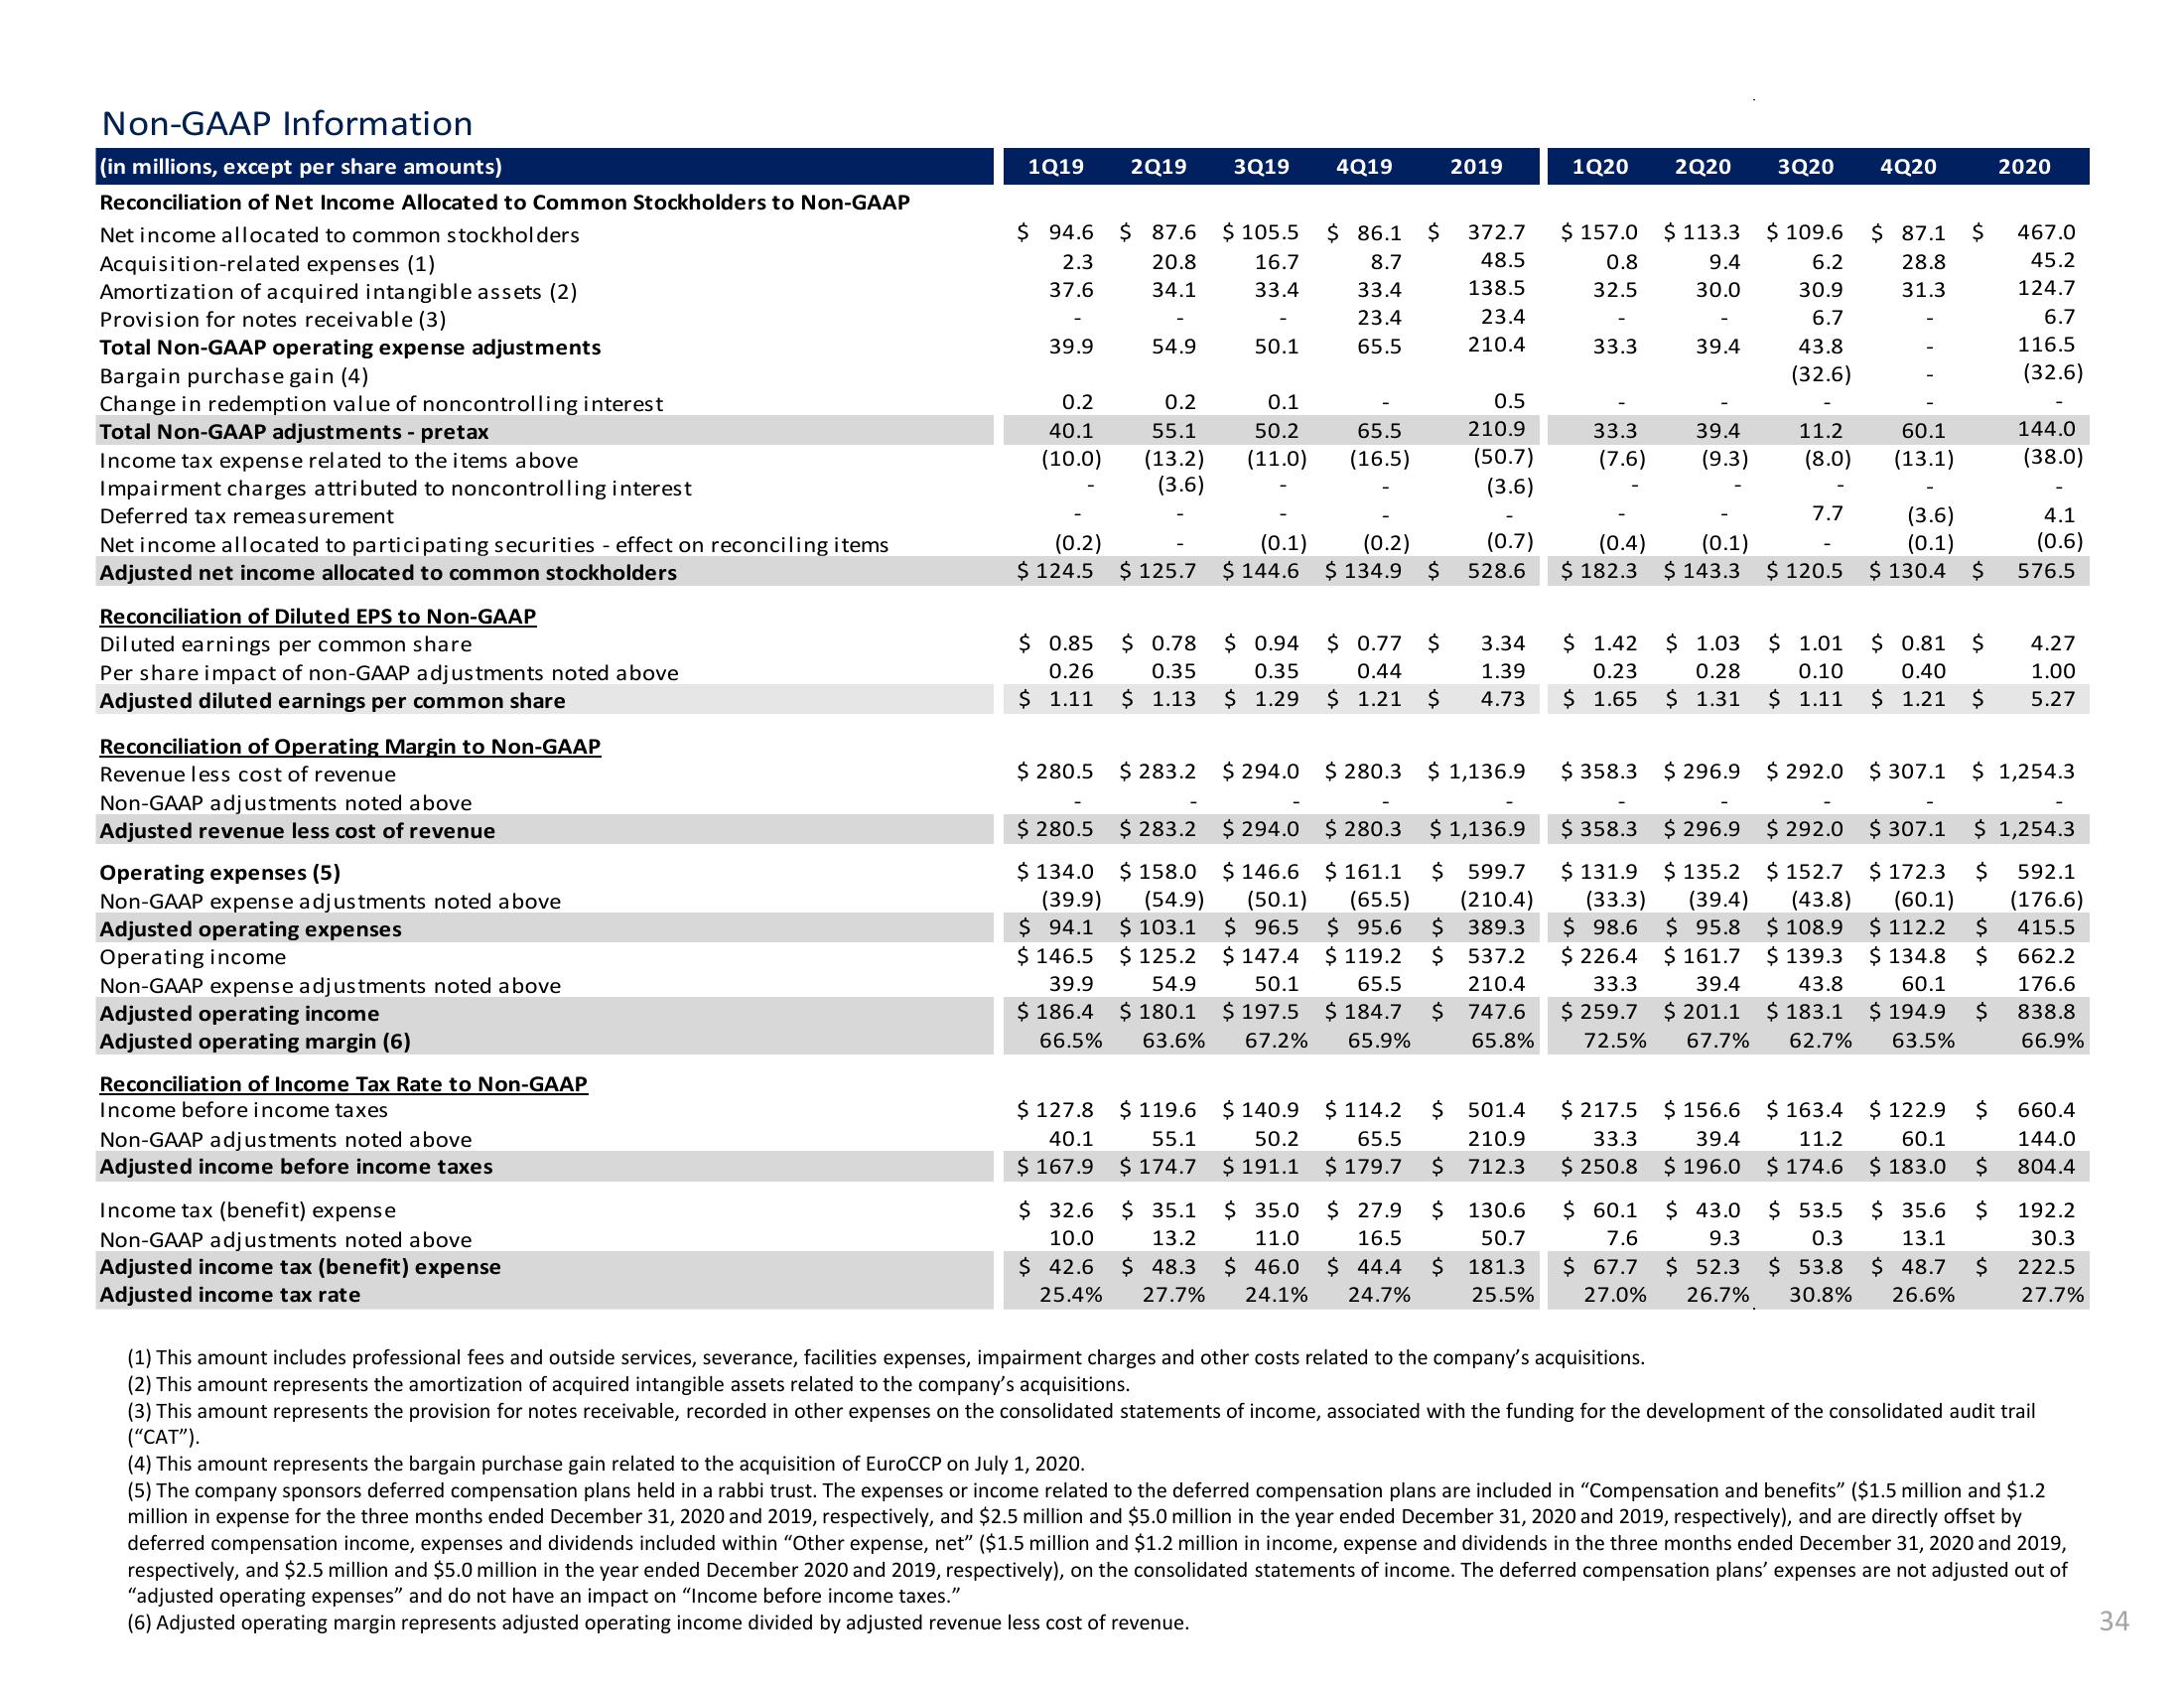
Non-GAAP Information
(in millions, except per share amounts)
Reconciliation of Net Income Allocated to Common Stockholders to Non-GAAP
Net income allocated to common stockholders
Acquisition-related expenses (1)
Amortization of acquired intangible assets (2)
Provision for notes receivable (3)
Total Non-GAAP operating expense adjustments
Bargain purchase gain (4)
Change in redemption value of noncontrolling interest
Total Non-GAAP adjustments - pretax
Income tax expense related to the items above
Impairment charges attributed to noncontrolling interest
Deferred tax remeasurement
Net income allocated to participating securities - effect on reconciling items
Adjusted net income allocated to common stockholders
Reconciliation of Diluted EPS to Non-GAAP
Diluted earnings per common share
Per share impact of non-GAAP adjustments noted above
Adjusted diluted earnings per common share
Reconciliation of Operating Margin to Non-GAAP
Revenue less cost of revenue
Non-GAAP adjustments noted above
Adjusted revenue less cost of revenue
Operating expenses (5)
Non-GAAP expense adjustments noted above
Adjusted operating expenses
Operating income
Non-GAAP expense adjustments noted above
Adjusted operating income
Adjusted operating margin (6)
Reconciliation of Income Tax Rate to Non-GAAP
Income before income taxes
Non-GAAP adjustments noted above
Adjusted income before income taxes
Income tax (benefit) expense
Non-GAAP adjustments noted above
Adjusted income tax (benefit) expense
Adjusted income tax rate
1Q19 2Q19 3Q19 4Q19
$94.6
2.3
37.6
39.9
0.2
40.1
(10.0)
(0.2)
$ 124.5
$ 0.85
0.26
$ 1.11
$ 280.5
$ 280.5
$ 134.0
(39.9)
$94.1
$ 146.5
39.9
$ 186.4
66.5%
$ 87.6
20.8
34.1
54.9
0.2
55.1
(13.2)
(3.6)
$ 125.7
$ 0.78
0.35
$ 1.13
$ 283.2
$ 283.2
$ 158.0
(54.9)
$ 103.1
$ 125.2
54.9
$ 180.1
63.6%
$ 105.5 $ 86.1
16.7
8.7
33.4
33.4
23.4
65.5
$ 119.6
55.1
$ 174.7
50.1
0.1
50.2
(11.0)
(0.1)
$ 144.6
$ 0.94
0.35
$ 1.29
$ 294.0
65.5
(16.5)
(0.2)
$ 134.9 $
$ 0.77 $
0.44
$ 1.21 $
$ 294.0
$ 280.3
$161.1
(65.5)
$ 95.6
$ 119.2
50.1
65.5
$197.5 $ 184.7
67.2% 65.9%
$ 146.6
(50.1)
$ 96.5
$ 147.4
$ 127.8
40.1
$ 167.9
$ 32.6
10.0
$ 42.6
$140.9 $ 114.2
50.2 65.5
$ 191.1 $ 179.7
$ 35.1 $ 35.0
13.2
11.0
$48.3 $ 46.0
25.4% 27.7% 24.1%
$ 372.7
48.5
138.5
23.4
210.4
2019
$ 27.9
16.5
$ 44.4
24.7%
0.5
210.9
(50.7)
(3.6)
$280.3 $ 1,136.9
(0.7)
528.6
3.34
1.39
4.73
$ 1,136.9
$ 599.7
(210.4)
$ 389.3
$ 537.2
210.4
$ 747.6
65.8%
$ 501.4
210.9
$ 712.3
$ 130.6
50.7
$ 181.3
25.5%
1Q20
$ 157.0
0.8
32.5
33.3
33.3
(7.6)
(0.4)
$ 182.3
$ 1.42
0.23
$ 1.65
$ 358.3
$ 358.3
$ 131.9
(33.3)
$ 98.6
$ 226.4
33.3
$ 259.7
72.5%
$ 217.5
33.3
$ 250.8
$ 60.1
7.6
$ 67.7
27.0%
2Q20 3Q20
$ 113.3
9.4
30.0
39.4
39.4
(9.3)
(0.1)
$ 143.3
$ 296.9
$ 109.6
6.2
30.9
6.7
43.8
(32.6)
$ 296.9
$135.2
(39.4)
$ 95.8
$ 161.7
39.4
$201.1
67.7%
11.2
(8.0)
$ 1.03 $ 1.01
0.28 0.10
$ 1.31 $ 1.11
$ 292.0
7.7 (3.6)
(0.1)
$ 120.5 $130.4 $
$ 292.0
$152.7
(43.8)
$108.9
$ 139.3
43.8
$ 183.1
62.7%
$ 156.6 $ 163.4
39.4
11.2
$ 196.0
$ 174.6
4Q20
$ 43.0
9.3
$ 53.5
0.3
$ 52.3 $ 53.8
26.7% 30.8%
$ 87.1 $
28.8
31.3
60.1
(13.1)
$ 0.81
$
0.40
$ 1.21 $
$ 122.9
60.1
$ 183.0
$ 35.6
13.1
$ 48.7
26.6%
$
$
$
2020
$
$
$
$
467.0
45.2
124.7
6.7
116.5
(32.6)
144.0
(38.0)
$307.1 $ 1,254.3
$ 307.1 $ 1,254.3
$172.3 $ 592.1
(60.1) (176.6)
$ 112.2
415.5
$ 134.8
60.1
$ 194.9
63.5%
662.2
176.6
838.8
66.9%
4.1
(0.6)
576.5
4.27
1.00
5.27
660.4
144.0
804.4
192.2
30.3
222.5
27.7%
(1) This amount includes professional fees and outside services, severance, facilities expenses, impairment charges and other costs related to the company's acquisitions.
(2) This amount represents the amortization of acquired intangible assets related to the company's acquisitions.
(3) This amount represents the provision for notes receivable, recorded in other expenses on the consolidated statements of income, associated with the funding for the development of the consolidated audit trail
("CAT").
(4) This amount represents the bargain purchase gain related to the acquisition of EuroCCP on July 1, 2020.
(5) The company sponsors deferred compensation plans held in a rabbi trust. The expenses or income related to the deferred compensation plans are included in "Compensation and benefits" ($1.5 million and $1.2
million in expense for the three months ended December 31, 2020 and 2019, respectively, and $2.5 million and $5.0 million in the year ended December 31, 2020 and 2019, respectively), and are directly offset by
deferred compensation income, expenses and dividends included within "Other expense, net" ($1.5 million and $1.2 million in income, expense and dividends in the three months ended December 31, 2020 and 2019,
respectively, and $2.5 million and $5.0 million in the year ended December 2020 and 2019, respectively), on the consolidated statements of income. The deferred compensation plans' expenses are not adjusted out of
"adjusted operating expenses" and do not have an impact on "Income before income taxes."
(6) Adjusted operating margin represents adjusted operating income divided by adjusted revenue less cost of revenue.
34View entire presentation