TPG Results Presentation Deck
FAUM Rollforward
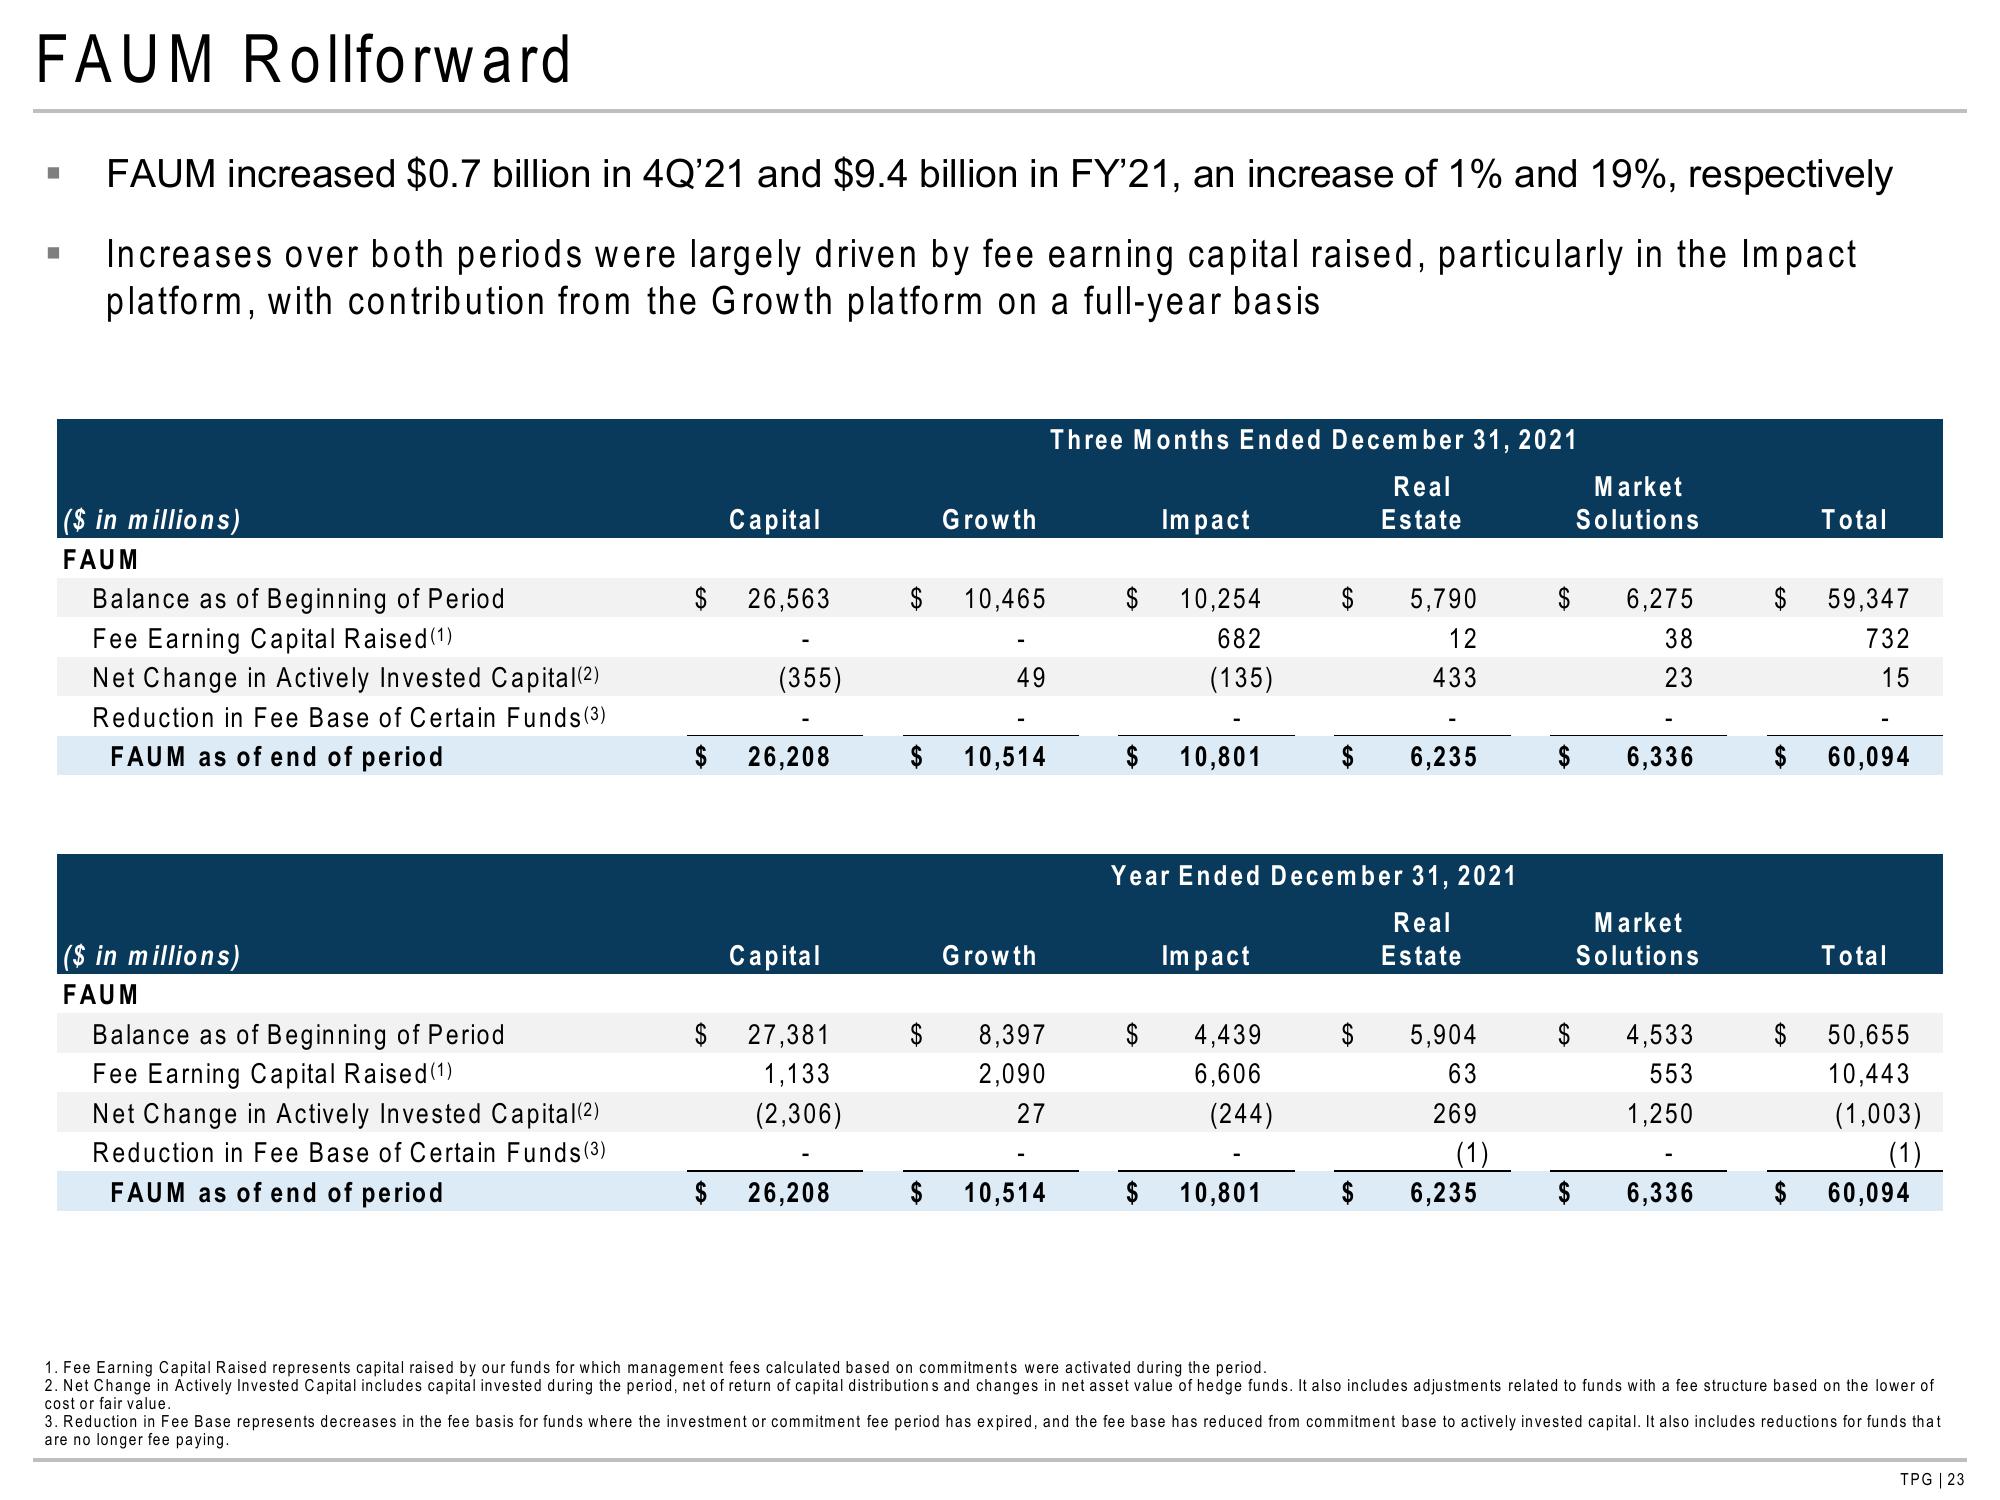
FAUM increased $0.7 billion in 4Q'21 and $9.4 billion in FY'21, an increase of 1% and 19%, respectively
Increases over both periods were largely driven by fee earning capital raised, particularly in the Impact
platform, with contribution from the Growth platform on a full-year basis
■
■
($ in millions)
FAUM
Balance as of Beginning of Period
Fee Earning Capital Raised (1)
Net Change in Actively Invested Capital (2)
Reduction in Fee Base of Certain Funds (3)
FAUM as of end of period
($ in millions)
FAUM
Balance as of Beginning of Period
Fee Earning Capital Raised (1)
Net Change in Actively Invested Capital (2)
Reduction in Fee Base of Certain Funds (3)
FAUM as of end of period
$
$
$
Capital
26,563
(355)
26,208
Capital
27,381
1,133
(2,306)
26,208
Growth
$ 10,465
49
10,514
Growth
8,397
2,090
27
10,514
Three Months Ended December 31, 2021
Real
Estate
Impact
$ 10,254
682
(135)
$
10,801
Year End December 31, 2021
Real
Estate
Impact
4,439
6,606
(244)
$ 5,790
12
433
10,801
6,235
5,904
63
269
(1)
6,235
Market
Solutions
6,275
38
23
6,336
Market
Solutions
4,533
553
1,250
6,336
$
$
$
Total
59,347
732
15
60,094
Total
50,655
10,443
(1,003)
(1)
60,094
1. Fee Earning Capital Raised represents capital raised by our funds for which management fees calculated based on commitments were activated during the period.
2. Net Change in Actively Invested Capital includes capital invested during the period, net of return of capital distributions and changes in net asset value of hedge funds. It also includes adjustments related to funds with a fee structure based on the lower of
cost or fair value.
3. Reduction in Fee Base represents decreases in the fee basis for funds where the investment or commitment fee period has expired, and the fee base has reduced from commitment base to actively invested capital. It also includes reductions for funds that
are no longer fee paying..
TPG | 23View entire presentation