Kinnevik Results Presentation Deck
Intro
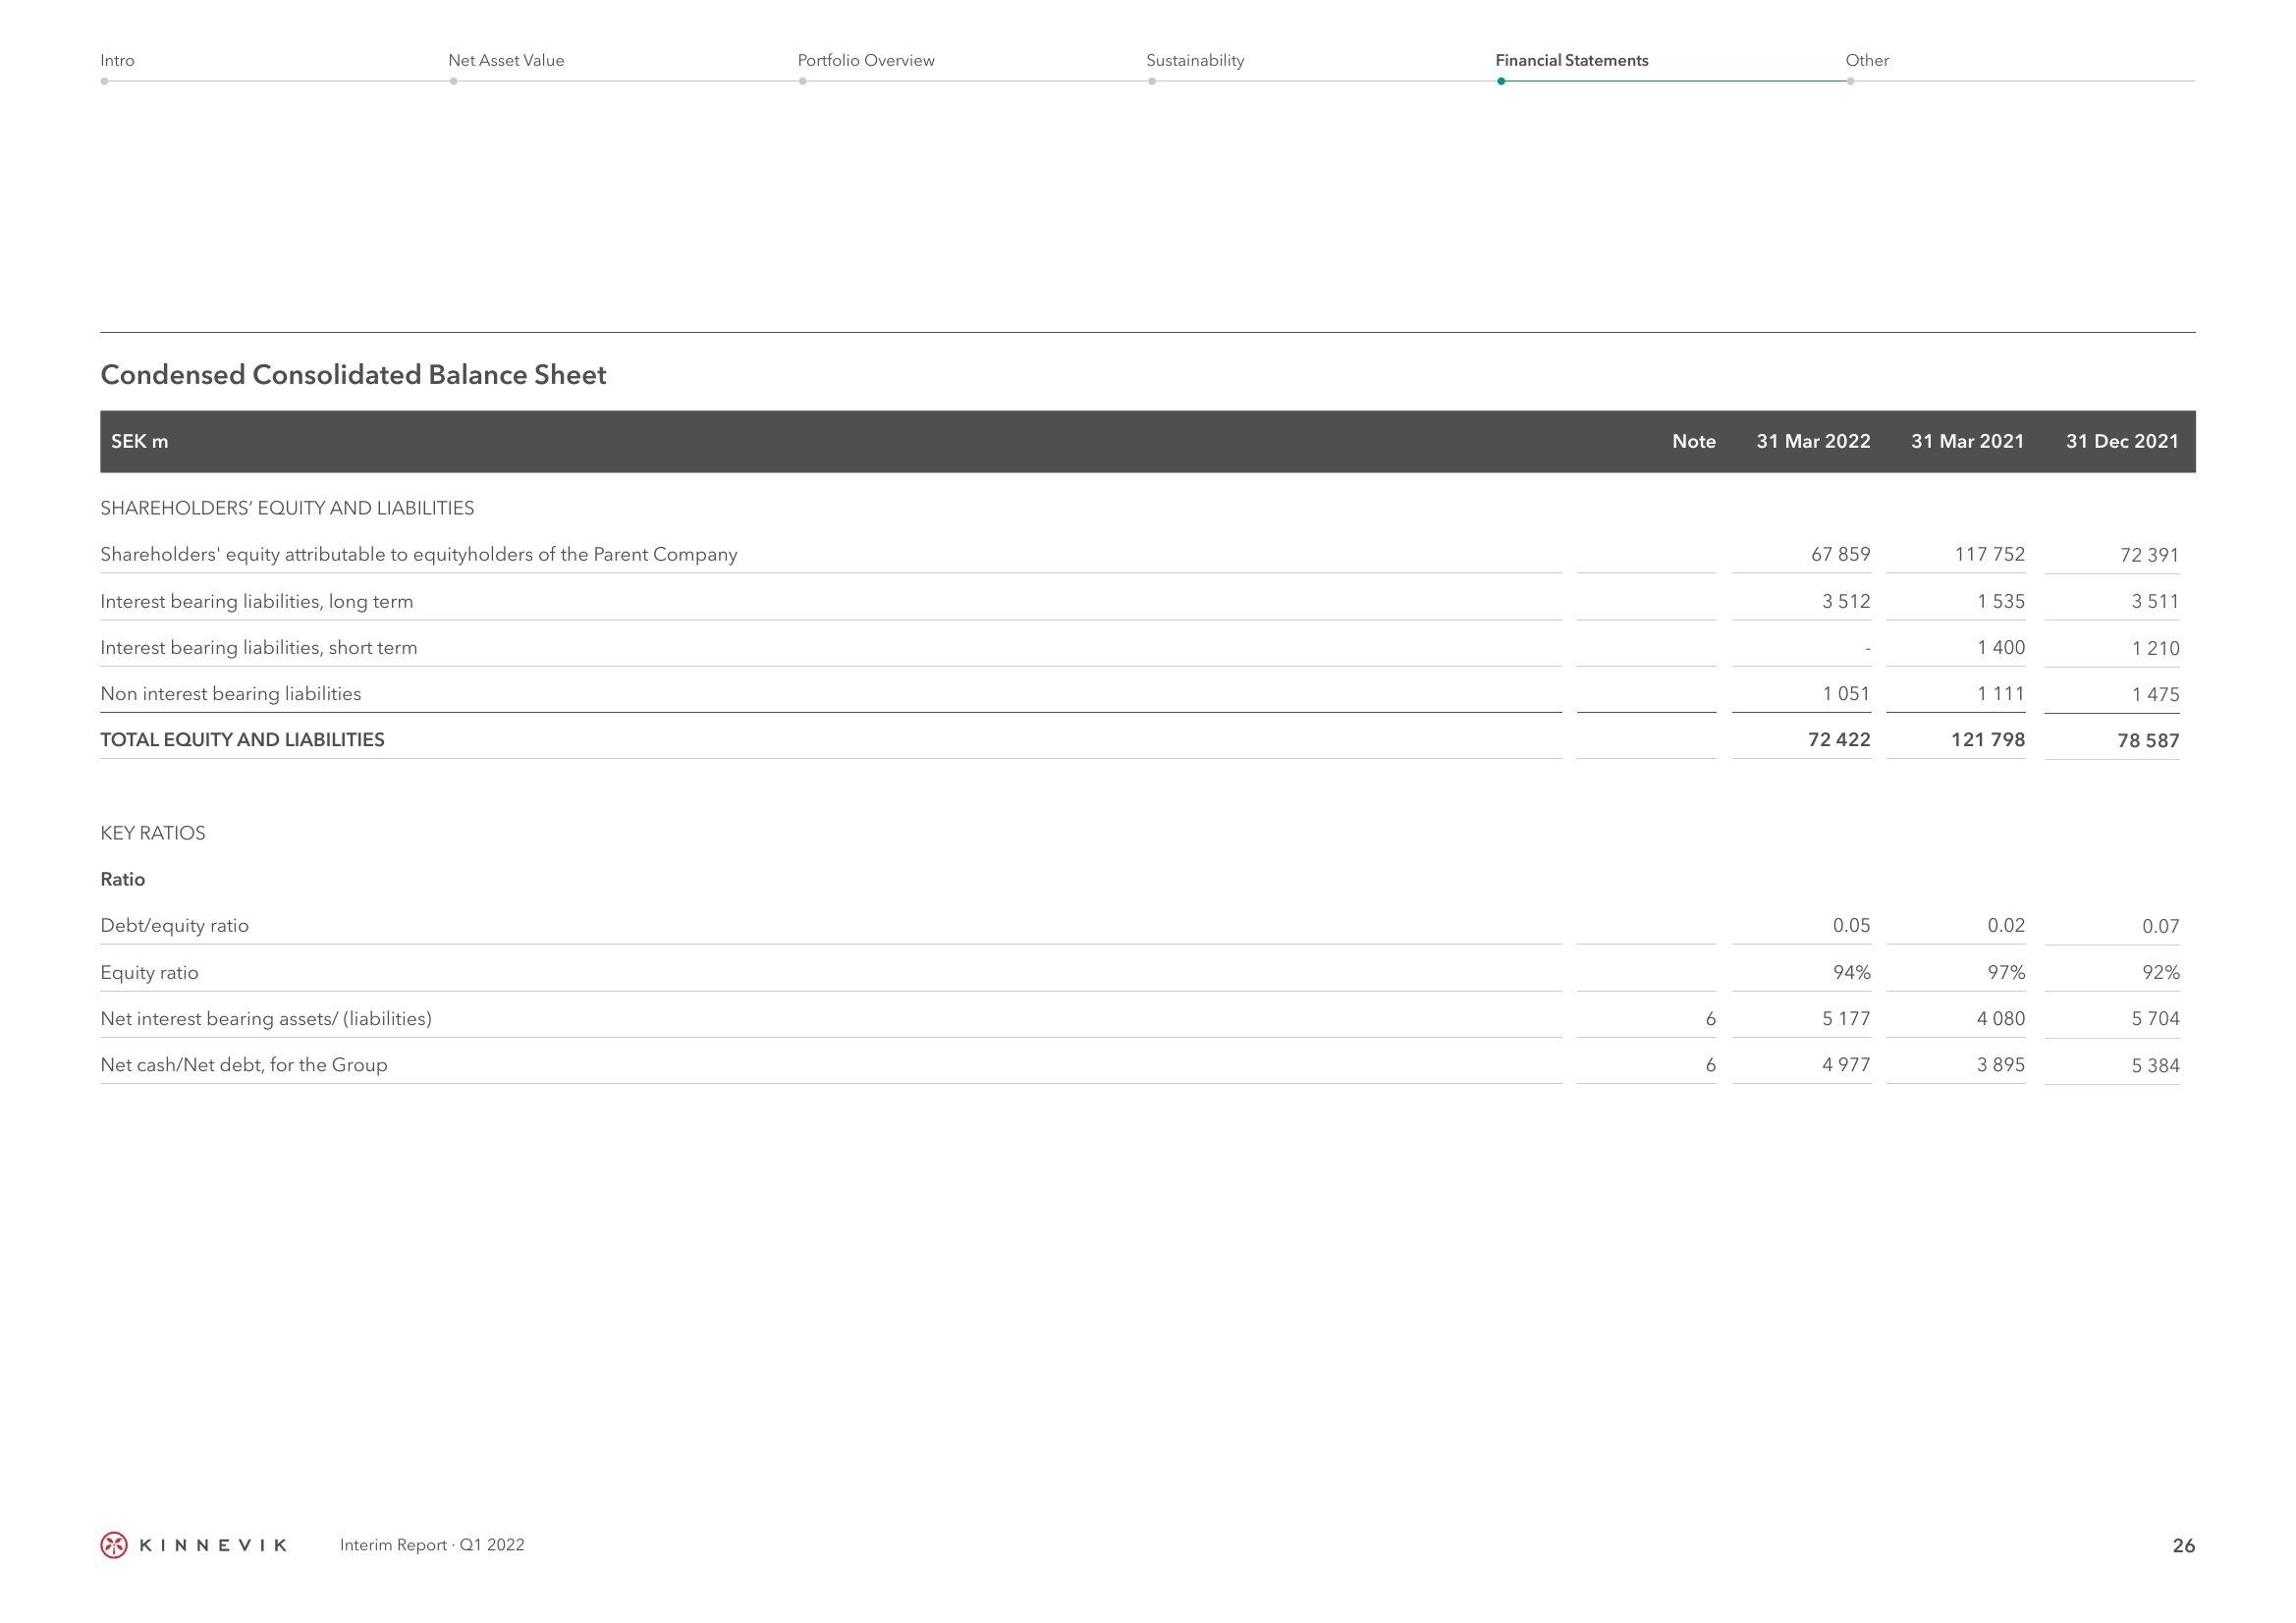
Condensed Consolidated Balance Sheet
SEK m
SHAREHOLDERS' EQUITY AND LIABILITIES
Shareholders' equity attributable to equityholders of the Parent Company
Interest bearing liabilities, long term
Interest bearing liabilities, short term
Non interest bearing liabilities
TOTAL EQUITY AND LIABILITIES
KEY RATIOS
Ratio
Net Asset Value
Debt/equity ratio
Equity ratio
Net interest bearing assets/ (liabilities)
Net cash/Net debt, for the Group
KINNEVIK
Interim Report Q1 2022
Portfolio Overview
Sustainability
Financial Statements
Note
6
6
Other
31 Mar 2022
67 859
3512
1 051
72 422
0.05
94%
5 177
4 977
31 Mar 2021
117 752
1 535
1 400
1111
121 798
0.02
97%
4 080
3 895
31 Dec 2021
72 391
3511
1210
1 475
78 587
0.07
92%
5 704
5 384
26View entire presentation