Pershing Square Activist Presentation Deck
Overview of 2021 Performance
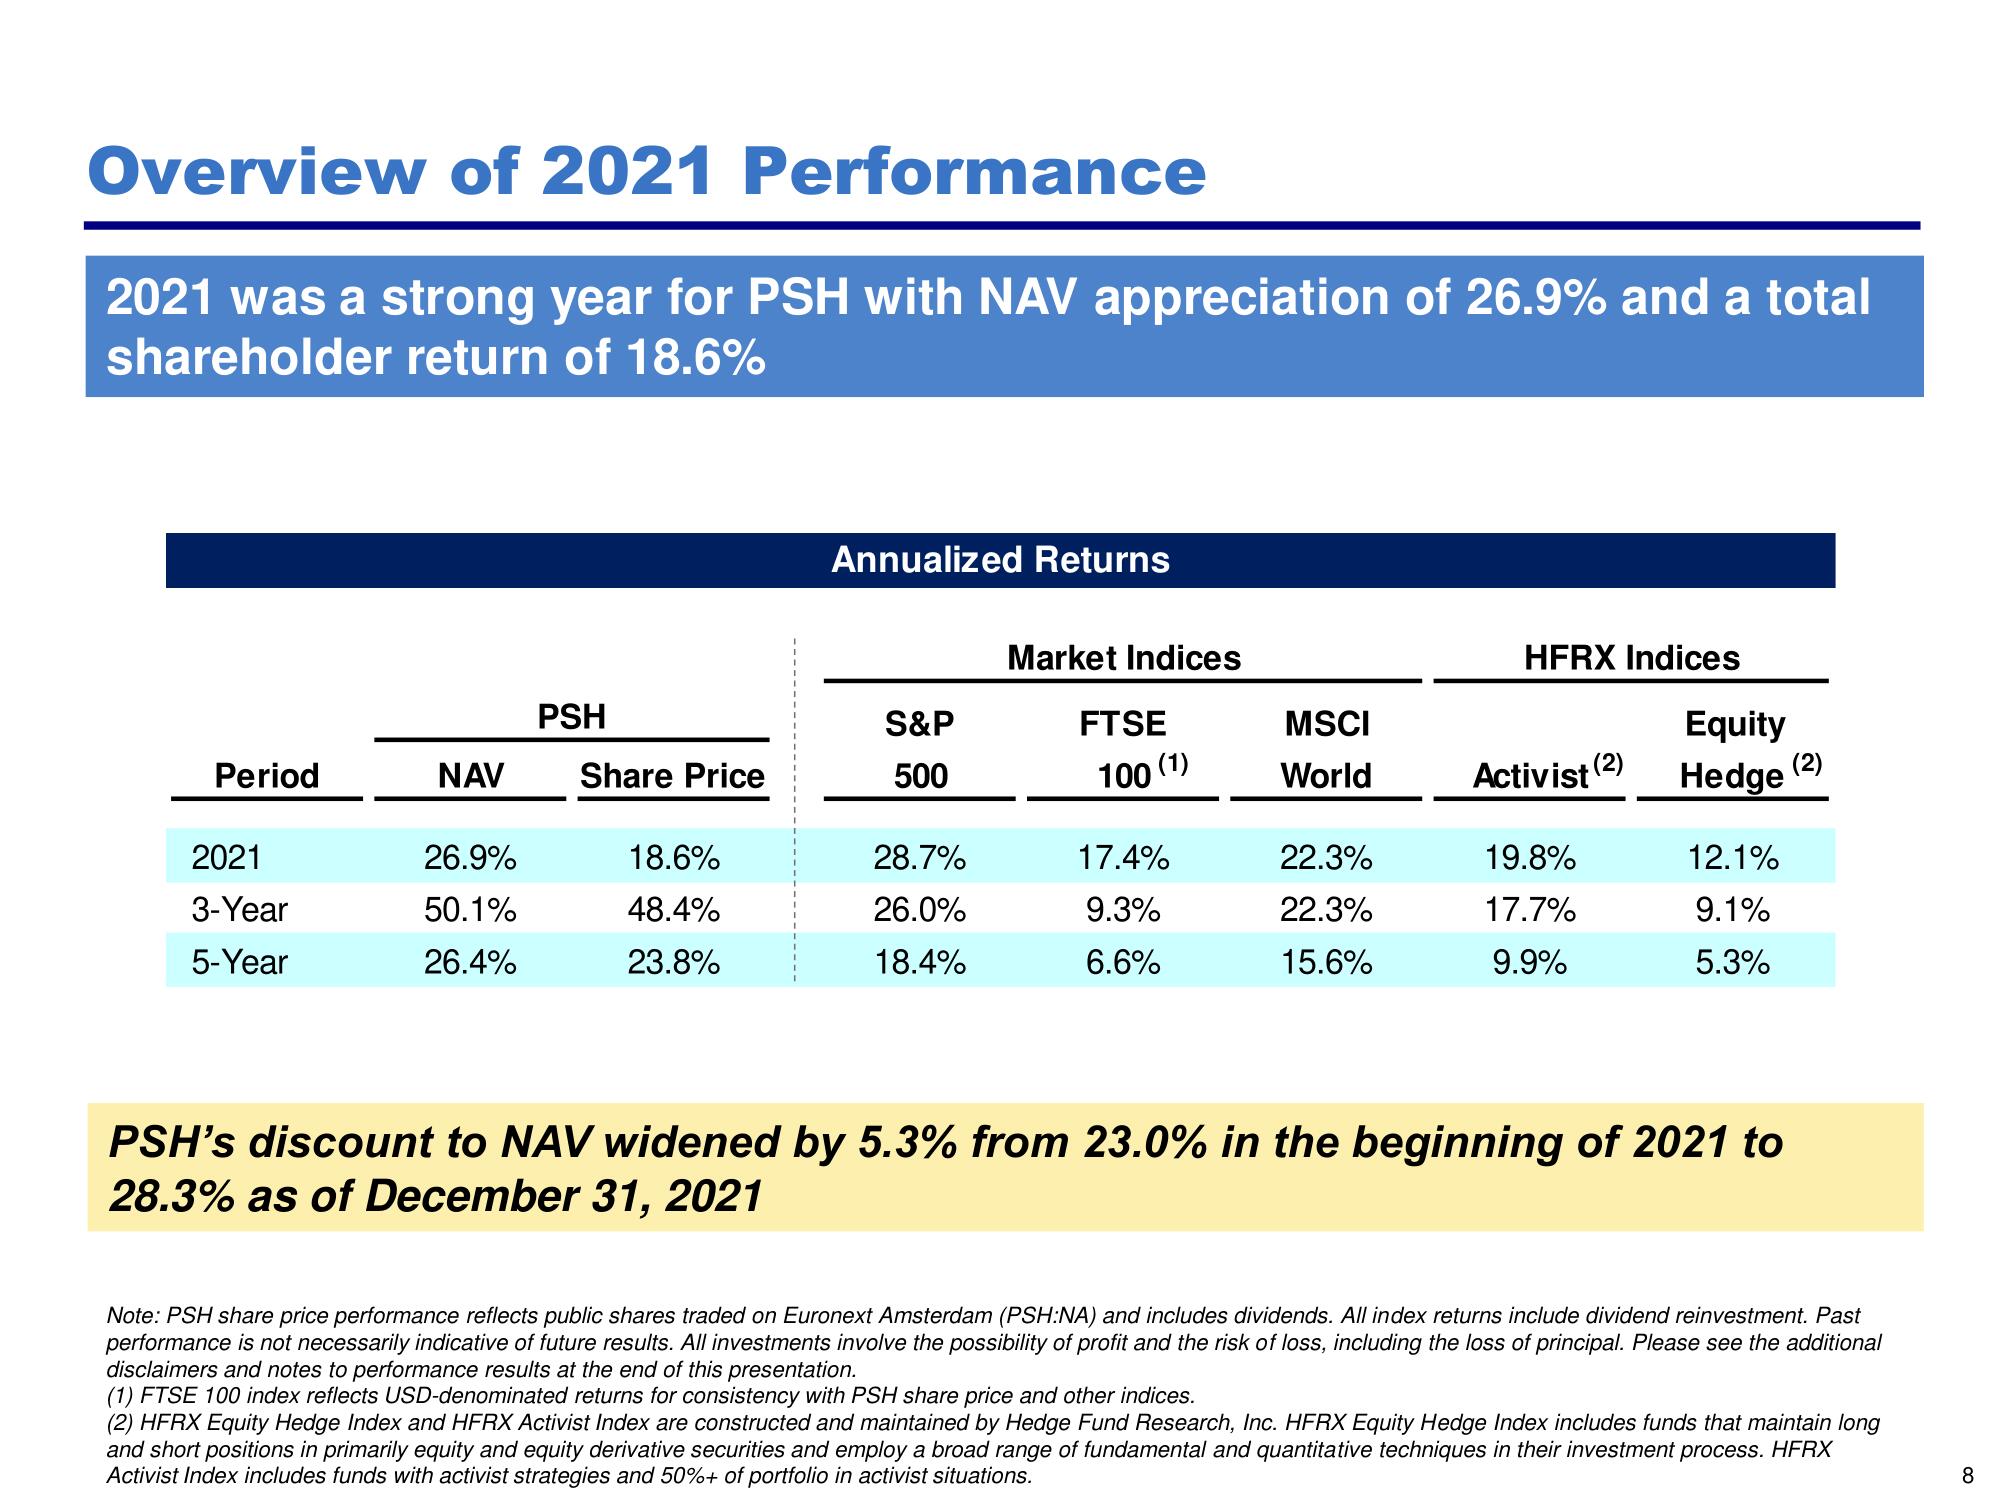
2021 was a strong year for PSH with NAV appreciation of 26.9% and a total
shareholder return of 18.6%
Period
2021
3-Year
5-Year
PSH
NAV Share Price
26.9%
50.1%
26.4%
18.6%
48.4%
23.8%
Annualized Returns
S&P
500
28.7%
26.0%
18.4%
Market Indices
FTSE
100 (1)
17.4%
9.3%
6.6%
MSCI
World
22.3%
22.3%
15.6%
HFRX Indices
Activist (2)
19.8%
17.7%
9.9%
Equity
Hedge
12.1%
9.1%
5.3%
PSH's discount to NAV widened by 5.3% from 23.0% in the beginning of 2021 to
28.3% as of December 31, 2021
(2)
Note: PSH share price performance reflects public shares traded on Euronext Amsterdam (PSH:NA) and includes dividends. All index returns include dividend reinvestment. Past
performance is not necessarily indicative of future results. All investments involve the possibility of profit and the risk of loss, including the loss of principal. Please see the additional
disclaimers and notes to performance results at the end of this presentation.
(1) FTSE 100 index reflects USD-denominated returns for consistency with PSH share price and other indices.
(2) HFRX Equity Hedge Index and HFRX Activist Index are constructed and maintained by Hedge Fund Research, Inc. HFRX Equity Hedge Index includes funds that maintain long
and short positions in primarily equity and equity derivative securities and employ a broad range of fundamental and quantitative techniques in their investment process. HFRX
Activist Index includes funds with activist strategies and 50%+ of portfolio in activist situations.
8View entire presentation