Bank of America Investment Banking Pitch Book
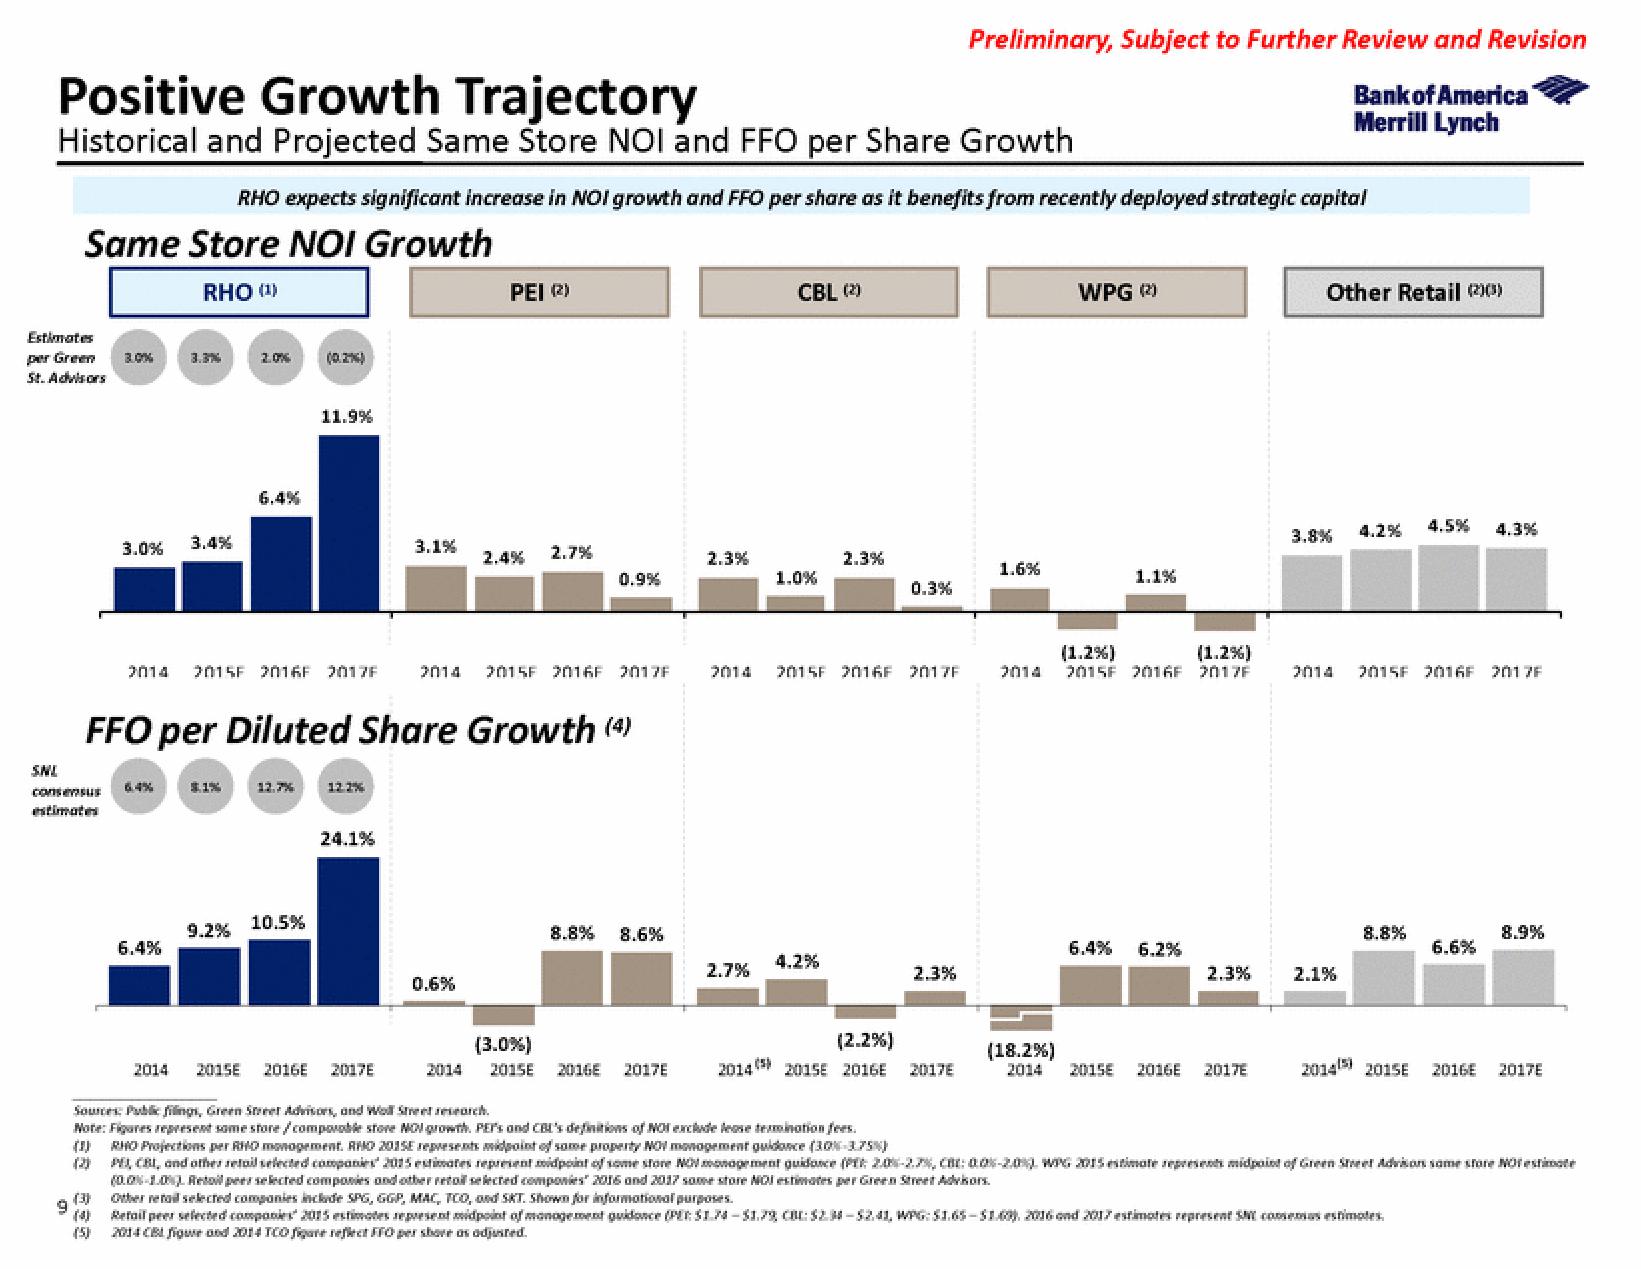
Positive Growth Trajectory
Historical and Projected Same Store NOI and FFO per Share Growth
Estimates
per Green 3.0%
St. Advisors
RHO expects significant increase in NOI growth and FFO per share as it benefits from recently deployed strategic capital
Same Store NOI Growth
RHO (¹)
9
SNI
consensus
estimates
3.0%
(5)
3.37%
3.4%
6.4%
2.0%
6.4%
$1%
2014 2015 2016 2017F
(0.27%)
11.9%
9.2% 10.5%
FFO per Diluted Share Growth (4)
12.2%
24.1%
3.1%
2014 2015E 2016E 2017E
PEI (2)
2.4% 2.7%
0.6%
0.9%
2014 2015 2016 2017F
8.8% 8.6%
(3.0%)
2014 2015E 2016E 2017E
2.3%
CBL (2)
2.7%
1.0%
2.3%
2014 2015 2016F 2017F
4.2%
0.3%
Preliminary, Subject to Further Review and Revision
Bank of America
Merrill Lynch
2.3%
(2.2%)
2014 (5) 2015E 2016E 2017E
1.6%
WPG (2²)
1.1%
(1.2%)
(1.2%)
2014 2015F 2016F 2017F
6.4% 6.2%
2.3%
(18.2%)
2014 2015E 2016E 2017E
Other Retail (20)
3.8%
2014
2.1%
4.2% 4.5% 4.3%
2015F 2016F 2017F
8.8%
6.6%
2014) 2015E 2016E
8.9%
2017E
Sources Public filings, Green Street Advisors, and Wall Street research.
Note: Figures represent some store/comparable store NOI growth. PEP's and CBI's definitions of NOT exclude lease termination fees.
(1) RHO Projections per RHO monopement. RHO 2015E represents midpoint of some property NOT monopement guidance (30%-3.75%)
PEI, CBI, and other retail selected companies 2015 estimates represent midpoint of some store NOT management guidance (PT 20%-2.7%, CB: 0.0%-20%) WPG 2015 estimate represents midpoint of Green Street Advison same store NOT estimate
(0.0%-10% Retail peer selected companies and other retol selected companies 2016 and 2017 some store NOI estimates per Green Street Advisors.
(12)
Other retail selected companies include SPG, GGP, MAC, TOO, and SKT. Shown for informational purposes.
Retailpeer selected companies 2015 estimates represent midpoint of management guidance (PE: $1.24-$1.79 CBC: $2.34-52.41, WPG: $1.65-$1.60), 2016 and 2017 estimates represent SM consensus estimates.
2014 CBL figwe and 2014 TCO figare reflect FFO per shore as adjusted.View entire presentation