Evercore Investment Banking Pitch Book
Supplemental Soda Ash Pricing Data
Domestic Soda Ash Prices i Evercore note: Page provided by SIRE management to
support management's view on projected soda ash prices
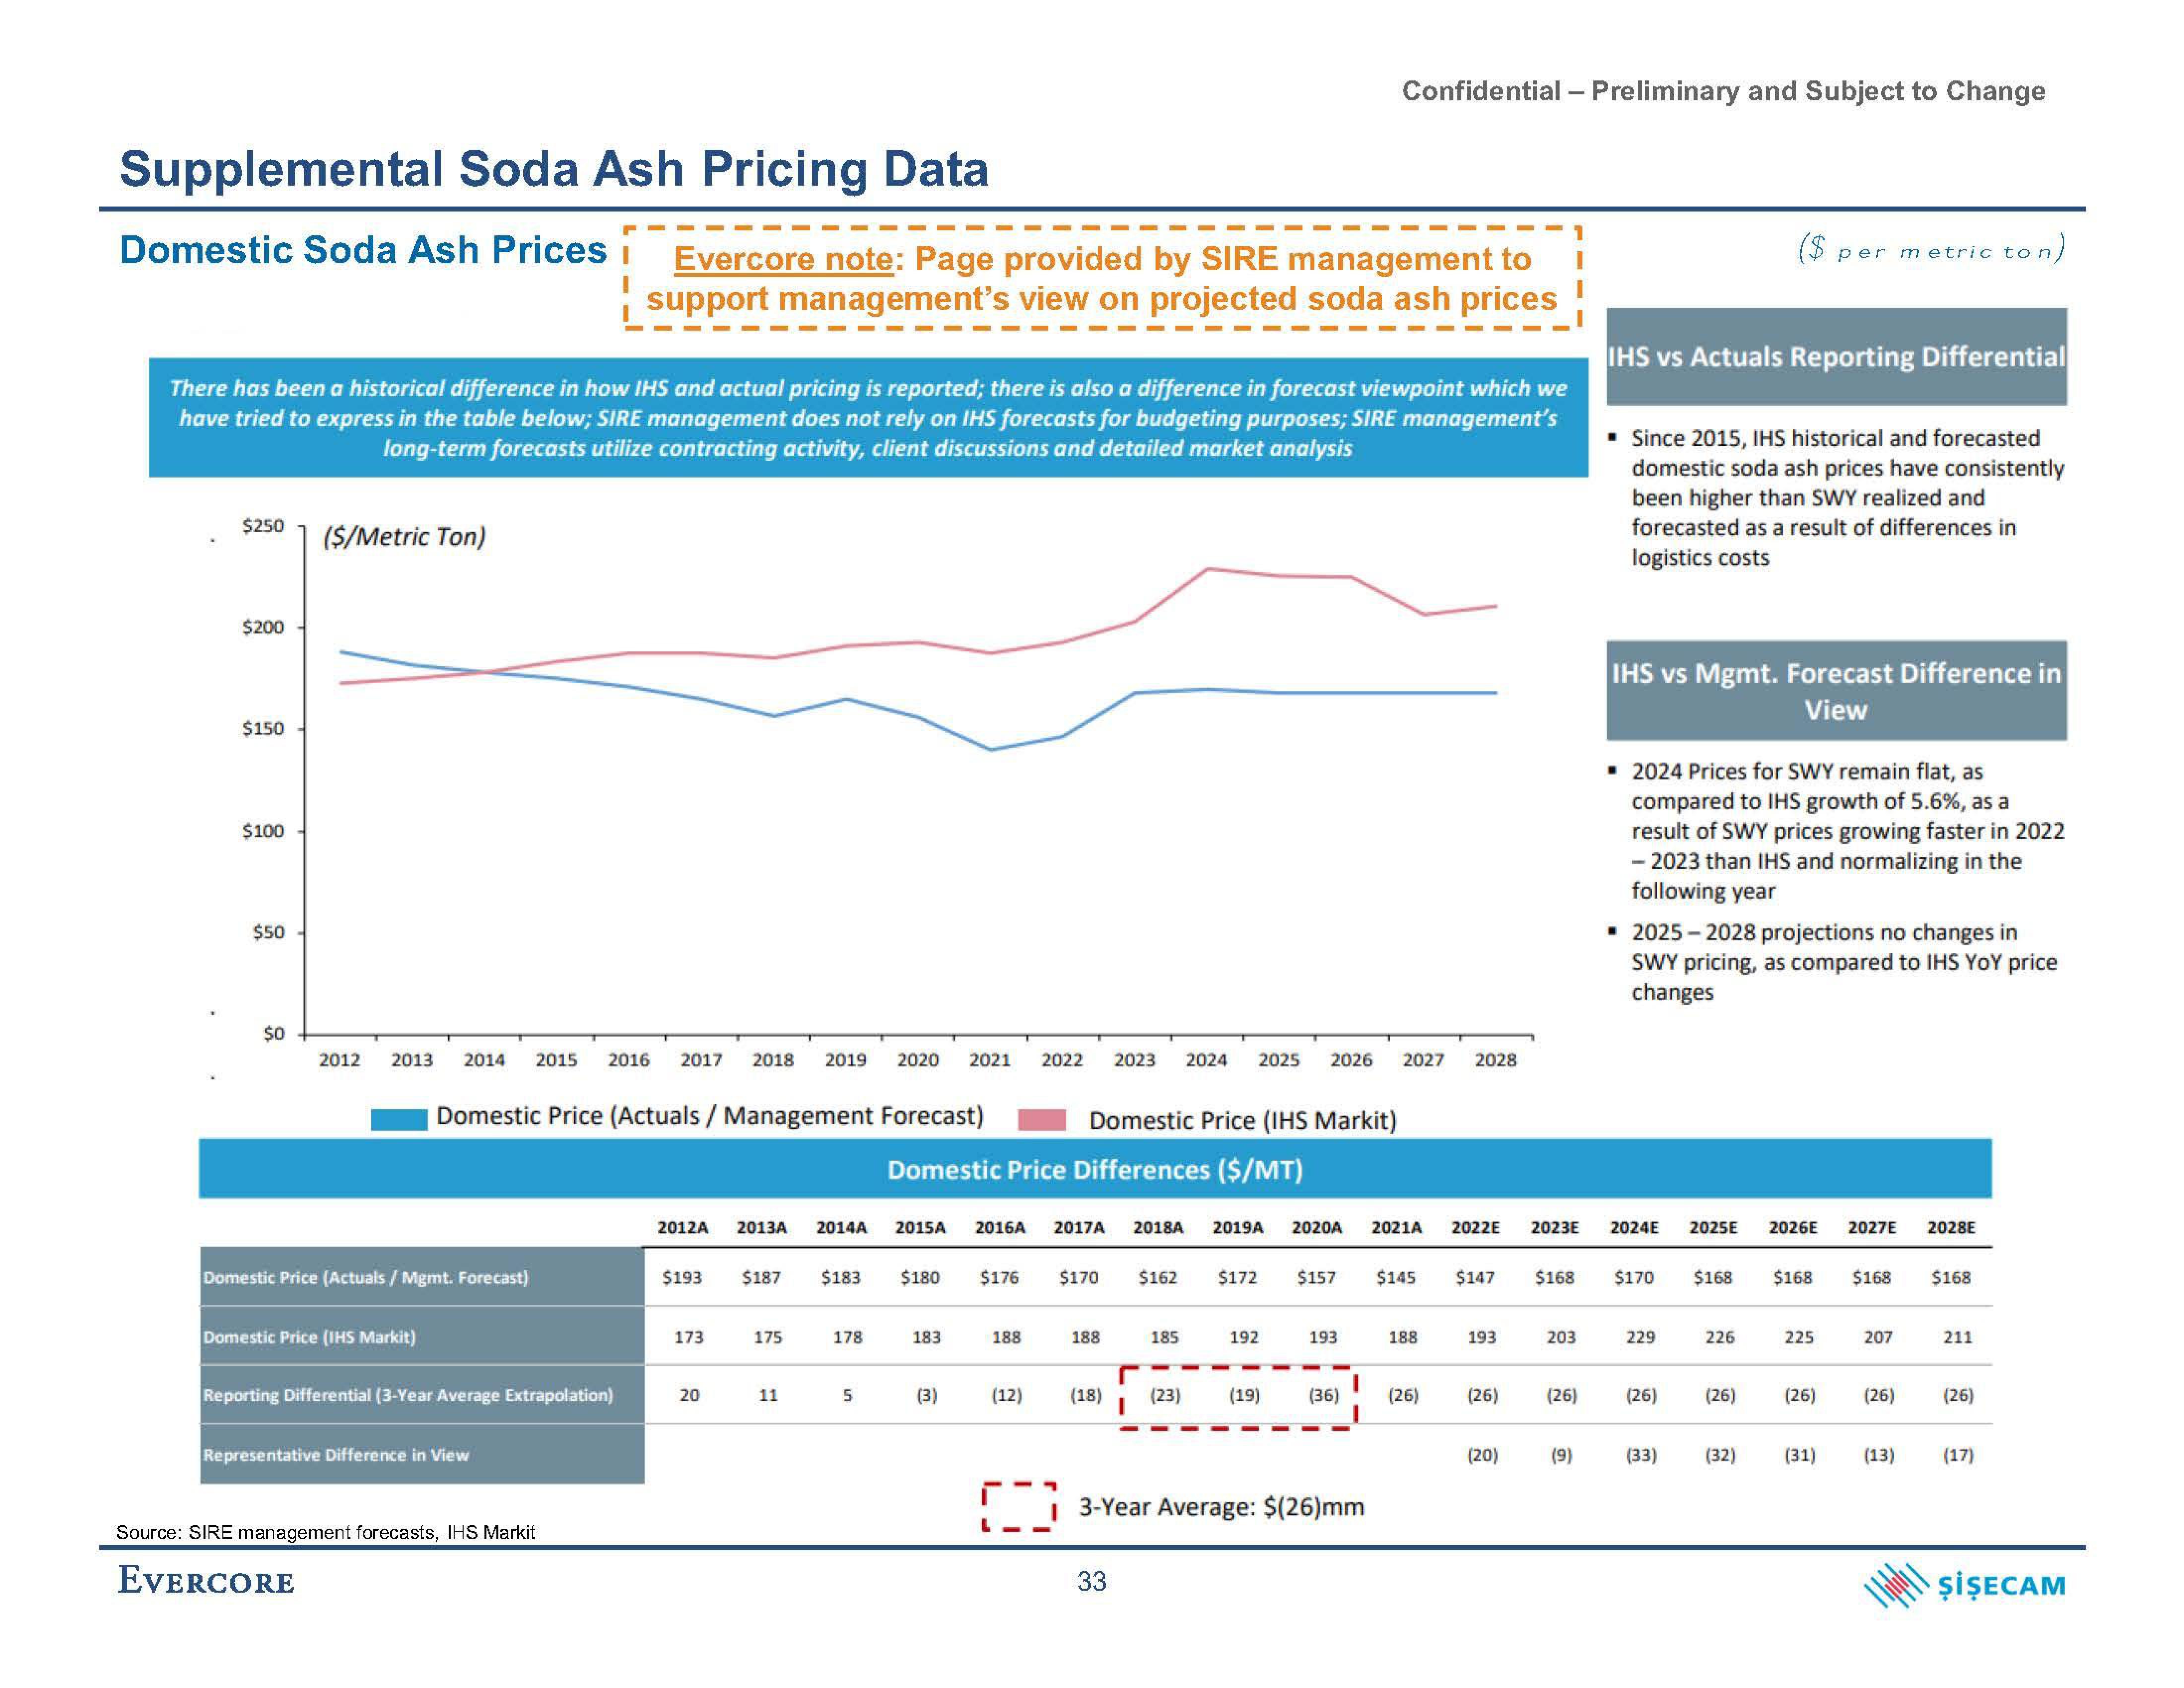
There has been a historical difference in how IHS and actual pricing is reported; there is also a difference in forecast viewpoint which we
have tried to express in the table below; SIRE management does not rely on IHS forecasts for budgeting purposes; SIRE management's
long-term forecasts utilize contracting activity, client discussions and detailed market analysis
$250
$200
$150
$100
$50
$0
($/Metric Ton)
2012
2013 2014 2015 2016 2017 2018 2019
Domestic Price (Actuals/Mgmt. Forecast)
Domestic Price (IHS Markit)
Domestic Price (Actuals / Management Forecast)
Reporting Differential (3-Year Average Extrapolation)
Representative Difference in View
Source: SIRE management forecasts, IHS Markit
EVERCORE
2012A 2013A 2014A
$193 $187 $183
173
20
175
11
178
2020 2021 2022
5
Domestic Price Differences ($/MT)
$180
183
2015A 2016A 2017A 2018A 2019A 2020A 2021A
(3)
$176
188
(12)
Domestic Price (IHS Markit)
0
2023 2024 2025 2026 2027 2028
$170 $162
188
185
r
(18) (23)
I
33
$172 $157
192
Confidential - Preliminary and Subject to Change
(19)
193
(36)
3-Year Average: $(26)mm
$145
188
(26)
2022E 2023E
193
(26)
(20)
203
(26)
$147 $168 $170
(9)
IHS vs Actuals Reporting Differential
Since 2015, IHS historical and forecasted
domestic soda ash prices have consistently
been higher than SWY realized and
forecasted as a result of differences in
logistics costs
IHS vs Mgmt. Forecast Difference in
View
▪ 2024 Prices for SWY remain flat, as
compared to IHS growth of 5.6%, as a
result of SWY prices growing faster in 2022
- 2023 than IHS and normalizing in the
following year
▪ 2025-2028 projections no changes in
SWY pricing, as compared to IHS YOY price
changes
2024E 2025E 2026E 2027E
229
(26)
(33)
$168
per metric ton)
226
(26)
(32)
$168
225
(31)
$168 $168
207
2028E
(26) (26) (26)
(13)
211
(17)
ŞİŞECAMView entire presentation