Bank of America Investment Banking Pitch Book
I
Income Statement:
Non-storm-related Services Revenue
% Growth
Storm-related Services Revenue
% Growth
New Opportunities Revenue
% Growth
Total Revenue
% Growth
Gross Profit
% Margin
EBITDA
% Margin
Memo: EBITDA (Excl New Opportunities)
EPS
Cash Flow:
D&A
% of Revenue
Capital Expenditures, Net
% of Revenue
(1)
Business Acquisitions
% of Revenue
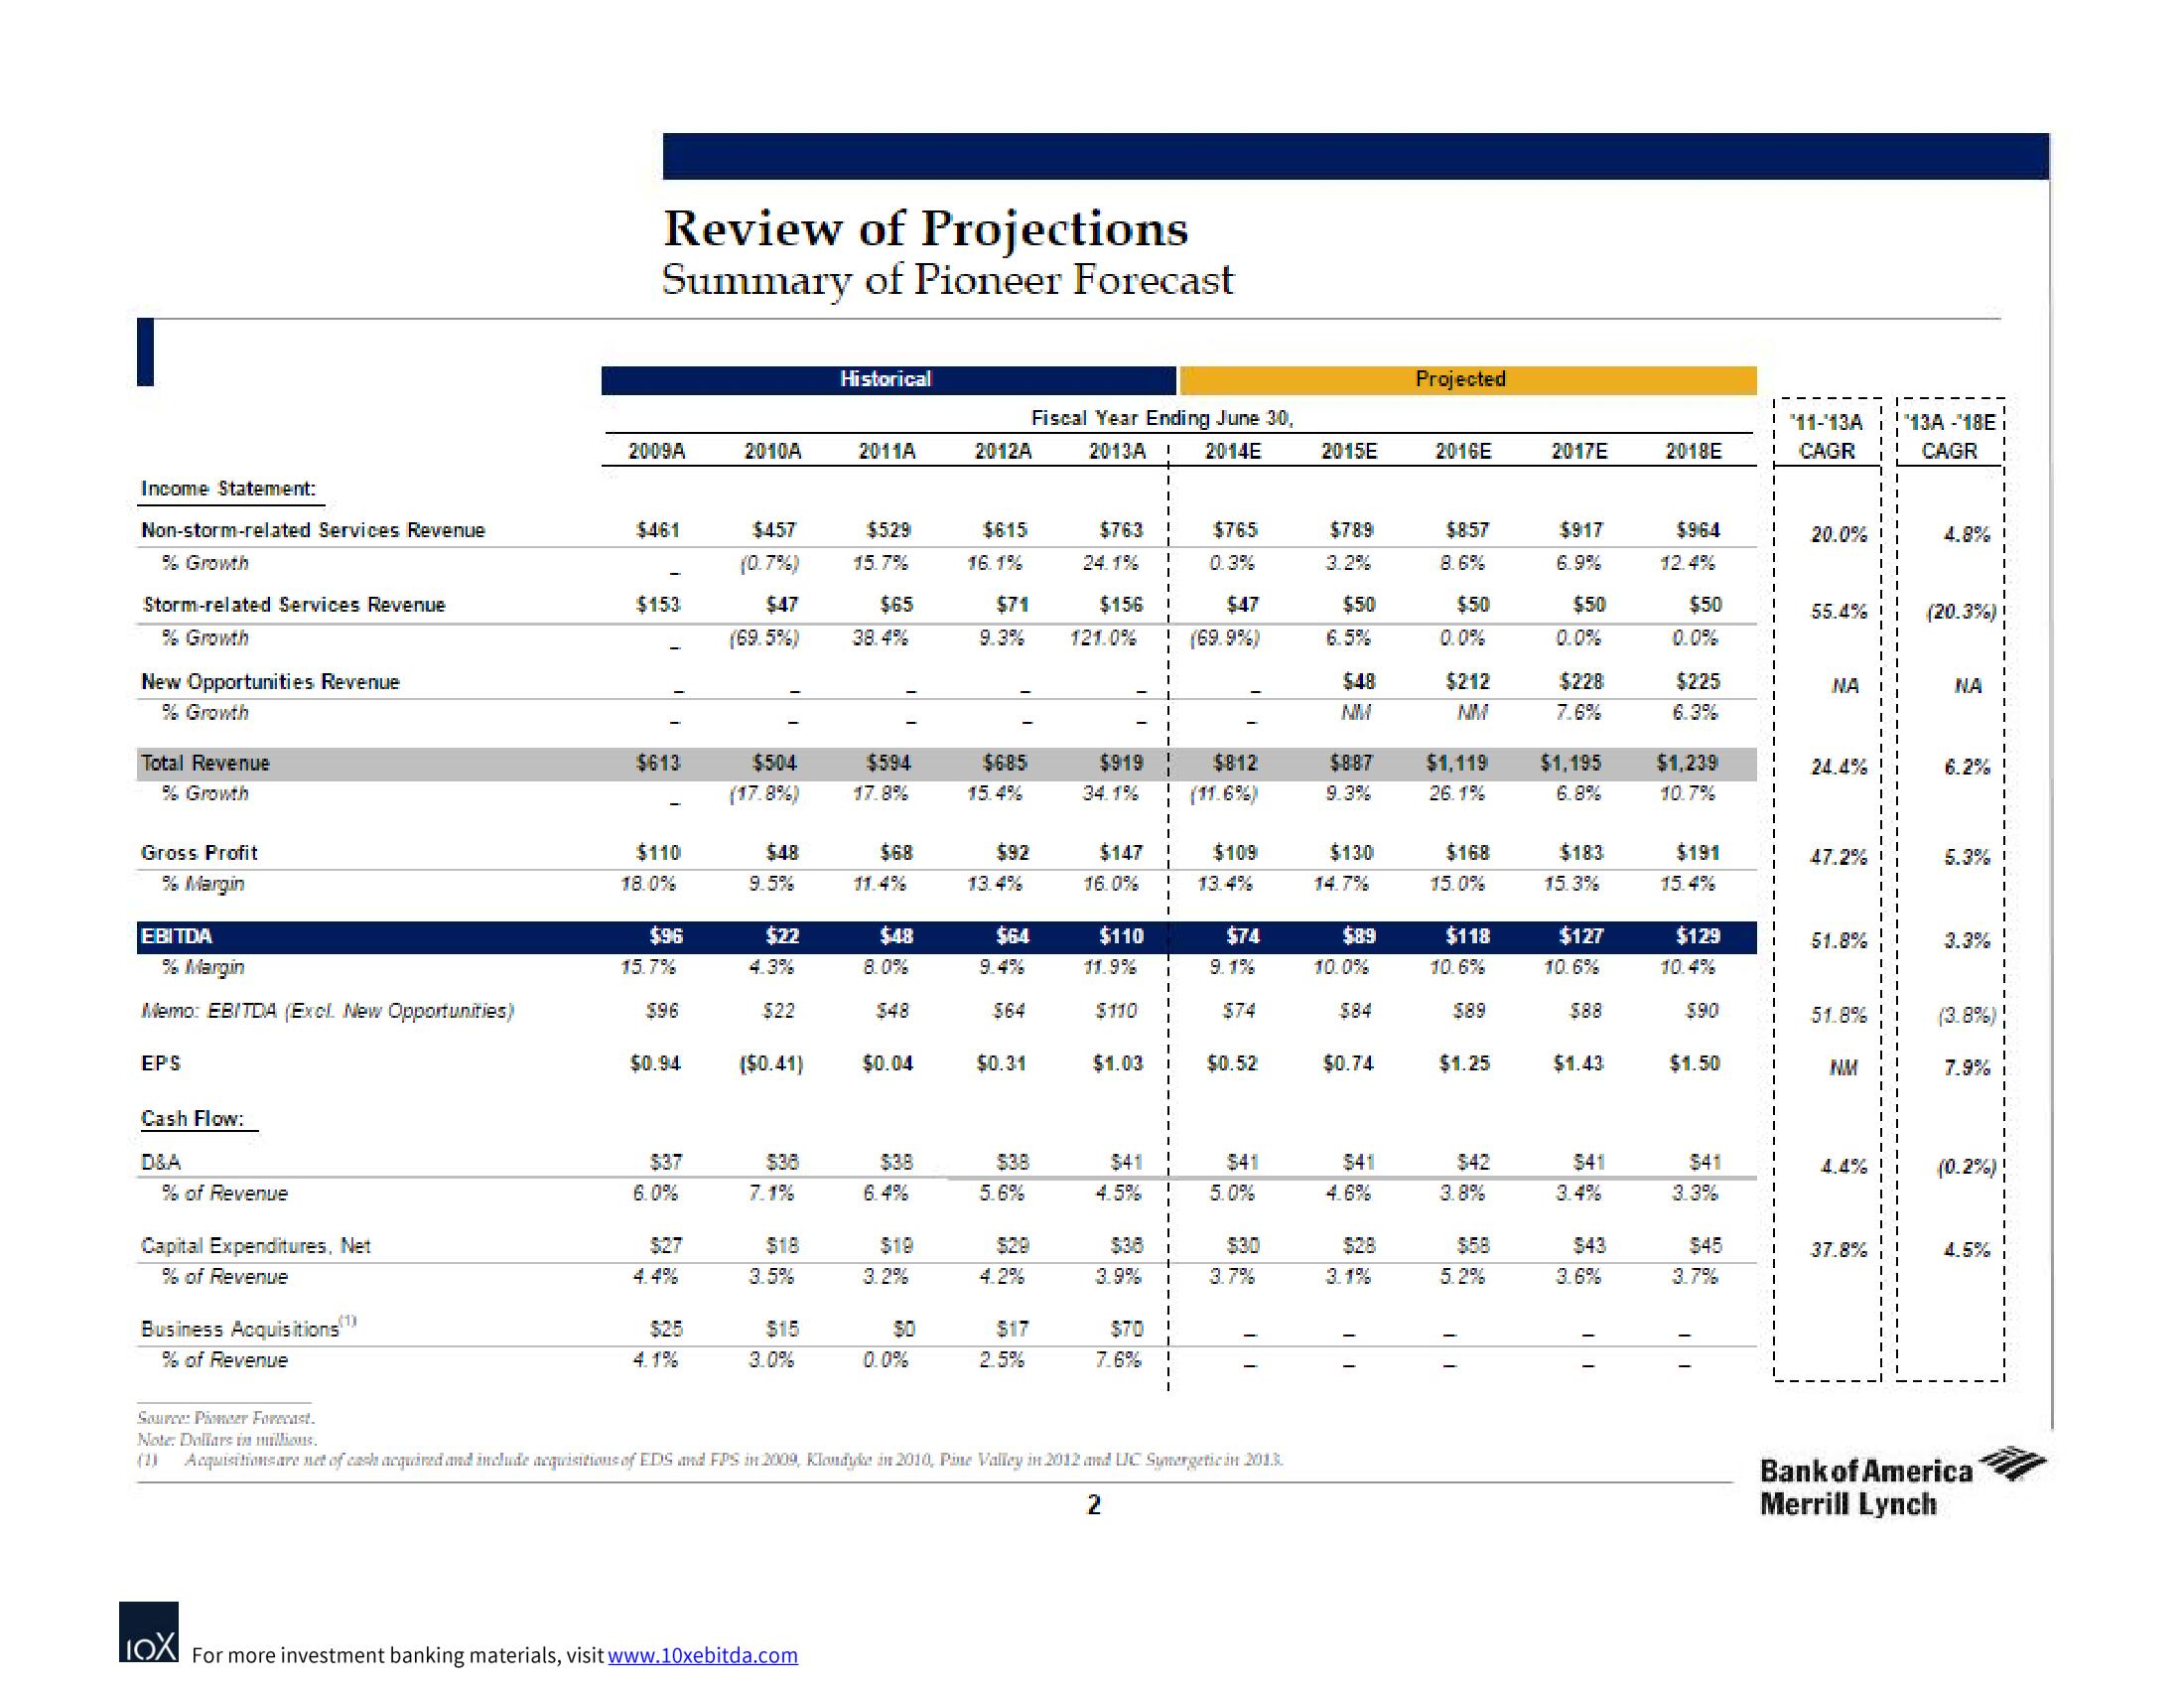
Review of Projections
Summary of Pioneer Forecast
2009A
$461
$153
$613
$110
18.0%
$96
15.7%
$0.94
$37
2010A
$457
(0.7%)
$47
(69.5%)
$504
(17.8%)
$48
9.5%
$22
4.3%
$22
($0.41)
$38
7.1%
$18
3.5%
$15
Historical
LOX For more investment banking materials, visit www.10xebitda.com
2011A
$529
15.7%
$65
38.4%
$594
17.8%
$68
$48
8.0%
$0.04
3.2%
2012A
$615
16.1%
$71
9.3%
$685
15.4%
$92
13.4%
$64
$0.31
$38
5.6%
Fiscal Year Ending June 30,
2013A I 2014E
4.2%
$17
2.5%
$763
24.1%
$156
121.0%
$919
34.1%
$147
16.0%
$110
11.9%
$110
$1.03
$41
4.5%
$70
7.6%
I
I
I
I
$765
$47
(69.9%)
$812
(11.6%)
$109
13.4%
$74
9.1%
$74
$0.52
$41
5.0%
3.7%
Source: Pioneer Forecast.
Note Dollars in millions.
(2) Acquisitions are not of cash acquired and include acquisitions of EDS and FPS in 2009, Klondyke in 2010, Pine Valley in 2012 and UC Synergetic in 2015.
2
2015E
$789
3.2%
$50
6.5%
$48
NM
$887
$130
14.7%
$89
10.0%
$0.74
$41
3.1%
Projected
2016E
$857
8.6%
$50
$212
NM
$1,119
26.1%
$168
15.0%
$118
10.6%
$1.25
$42
3.8%
5.2%
T!
2017E
$917
$50
0.0%
$228
$1,195
6.8%
$183
15.3%
$127
10.6%
$1.43
$41
$43
3.6%
2018E
$964
$50
$225
$1,239
$191
15.4%
$129
10.4%
$90
$1.50
$41
3.3%
$45
3.7%
"'11-'13A
CAGR
20.0%
55.4%
NA
24.4%
47.2%
51.8%
51.8%
NM
4.4%
37.8%
¹13A-18E
CAGR
4.8%
(20.3%)
NA
6.2%
5.3%
7.9%
(0.2%)
4.5%
Bank of America
Merrill LynchView entire presentation