MP Materials Investor Conference Presentation Deck
1.
2.
Continued
operational
execution
2020
2021
Stage II Hiring
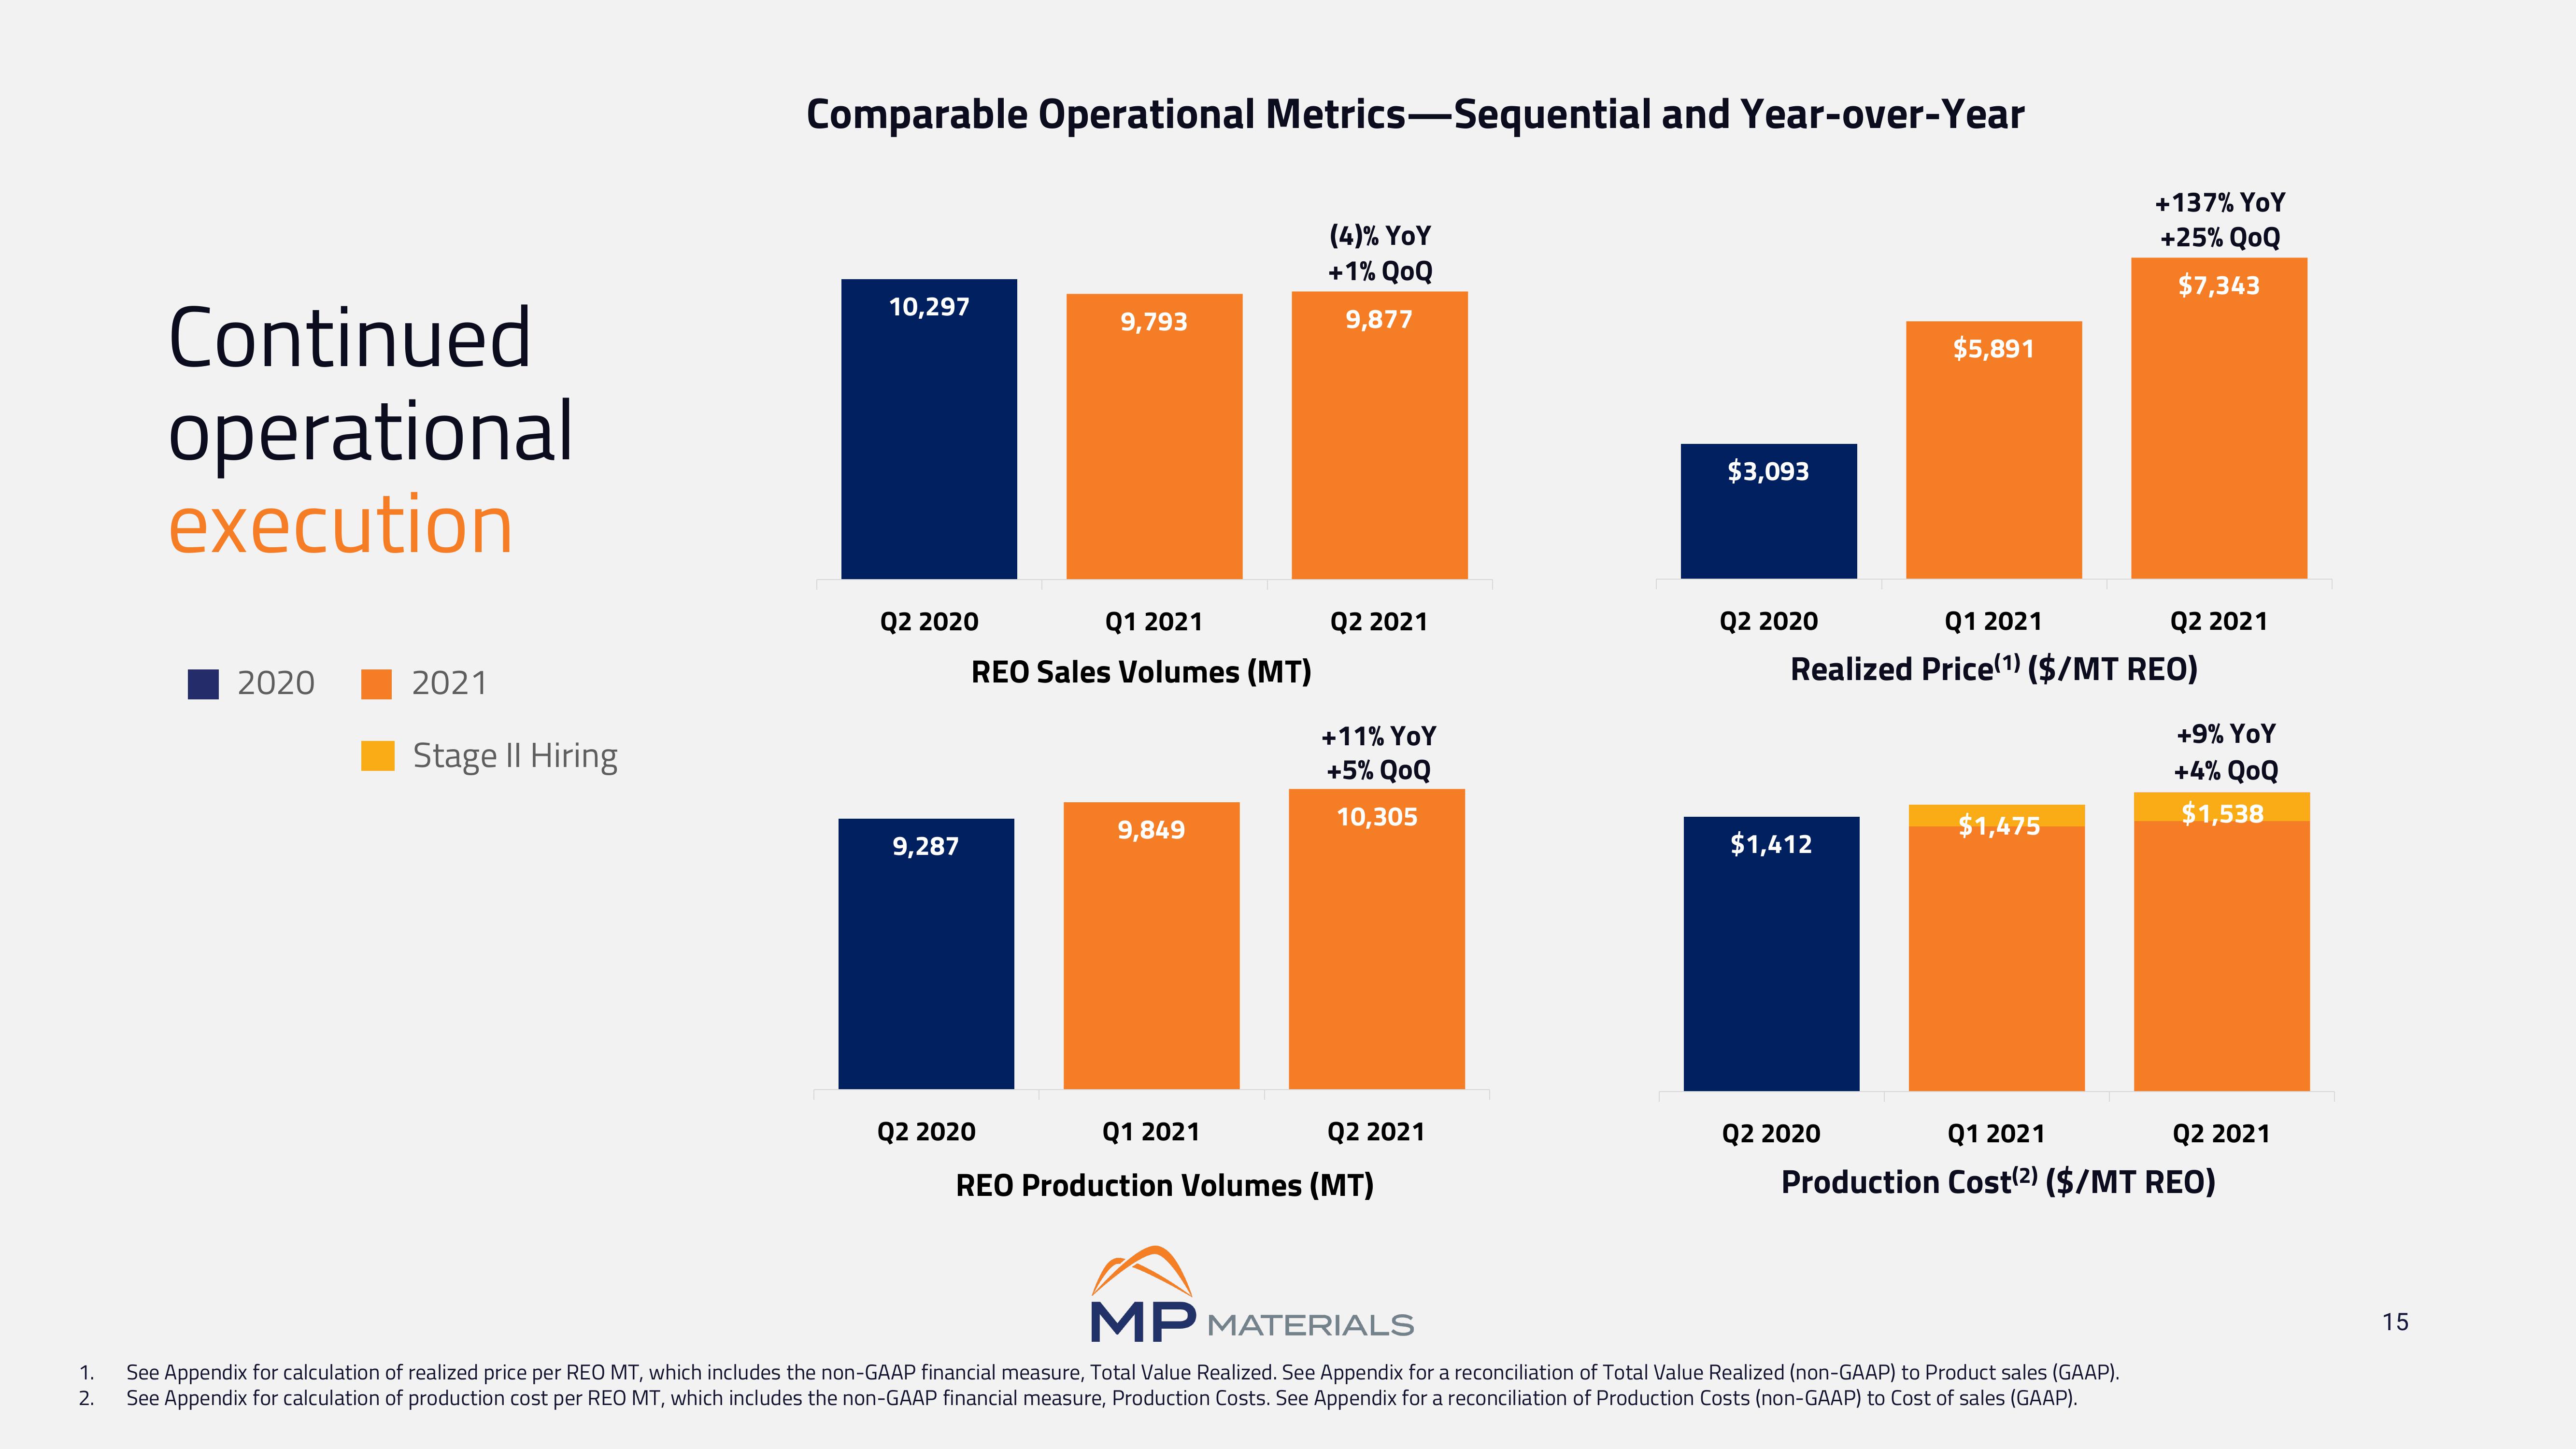
Comparable Operational Metrics-Sequential and Year-over-Year
10,297
Q2 2020
9,287
Q1 2021
REO Sales Volumes (MT)
9,793
Q2 2020
9,849
(4)% YOY
+1% QOQ
9,877
Q2 2021
+11% YoY
+5% QOQ
10,305
Q1 2021
REO Production Volumes (MT)
Q2 2021
$3,093
Q2 2020
Q1 2021
Realized Price(¹) ($/MT REO)
$1,412
$5,891
Q2 2020
$1,475
+137% YoY
+25% QOQ
$7,343
MP MATERIALS
See Appendix for calculation of realized price per REO MT, which includes the non-GAAP financial measure, Total Value Realized. See Appendix for a reconciliation of Total Value Realized (non-GAAP) to Product sales (GAAP).
See Appendix for calculation of production cost per REO MT, which includes the non-GAAP financial measure, Production Costs. See Appendix for a reconciliation of Production Costs (non-GAAP) to Cost of sales (GAAP).
Q2 2021
+9% YoY
+4% QOQ
$1,538
Q1 2021
Production Cost(2) ($/MT REO)
Q2 2021
15View entire presentation