Pershing Square Activist Presentation Deck
Track Record of Defensive Hedging
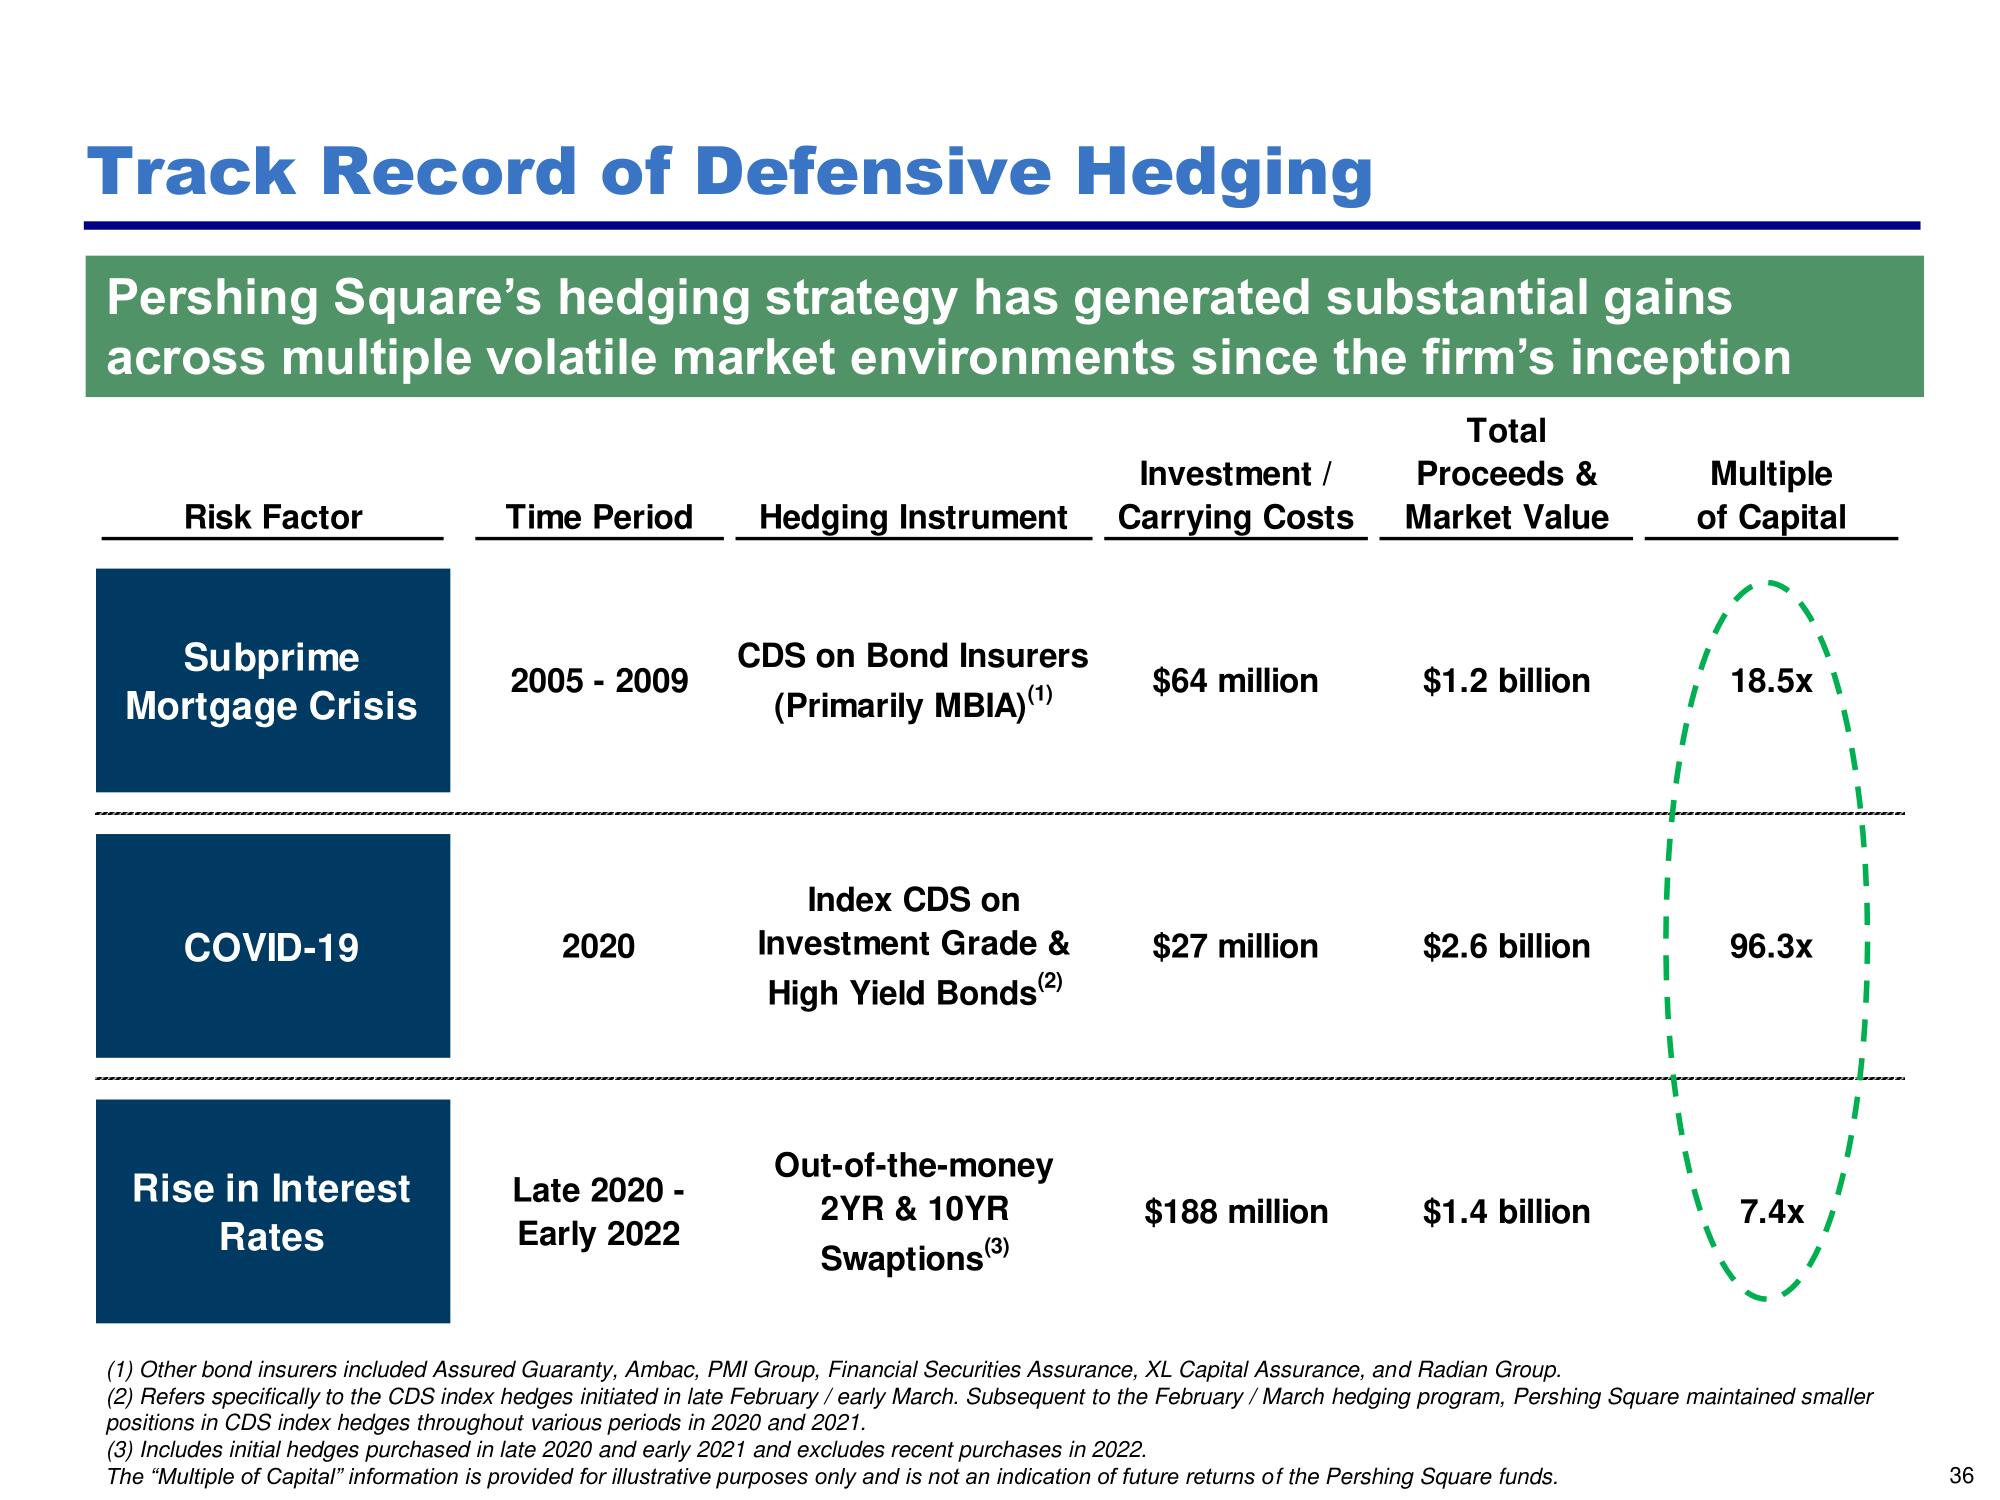
Pershing Square's hedging strategy has generated substantial gains
across multiple volatile market environments since the firm's inception
Risk Factor
Subprime
Mortgage Crisis
COVID-19
Rise in Interest
Rates
Time Period
2005 - 2009
2020
Late 2020 -
Early 2022
Hedging Instrument
CDS on Bond Insurers
(Primarily MBIA)(¹)
Index CDS on
Investment Grade &
High Yield Bonds (2)
Out-of-the-money
2YR & 10YR
Swaptions (3)
Investment /
Carrying Costs
$64 million
$27 million
$188 million
Total
Proceeds &
Market Value
$1.2 billion
$2.6 billion
$1.4 billion
Multiple
of Capital
(3) Includes initial hedges purchased in late 2020 and early 2021 and excludes recent purchases in 2022.
The "Multiple of Capital" information is provided for illustrative purposes only and is not an indication of future returns of the Pershing Square funds.
18.5x |
96.3x
7.4x
(1) Other bond insurers included Assured Guaranty, Ambac, PMI Group, Financial Securities Assurance, XL Capital Assurance, and Radian Group.
(2) Refers specifically to the CDS index hedges initiated in late February / early March. Subsequent to the February / March hedging program, Pershing Square maintained smaller
positions in CDS index hedges throughout various periods in 2020 and 2021.
36View entire presentation