Flutter Results Presentation Deck
Appendices
US
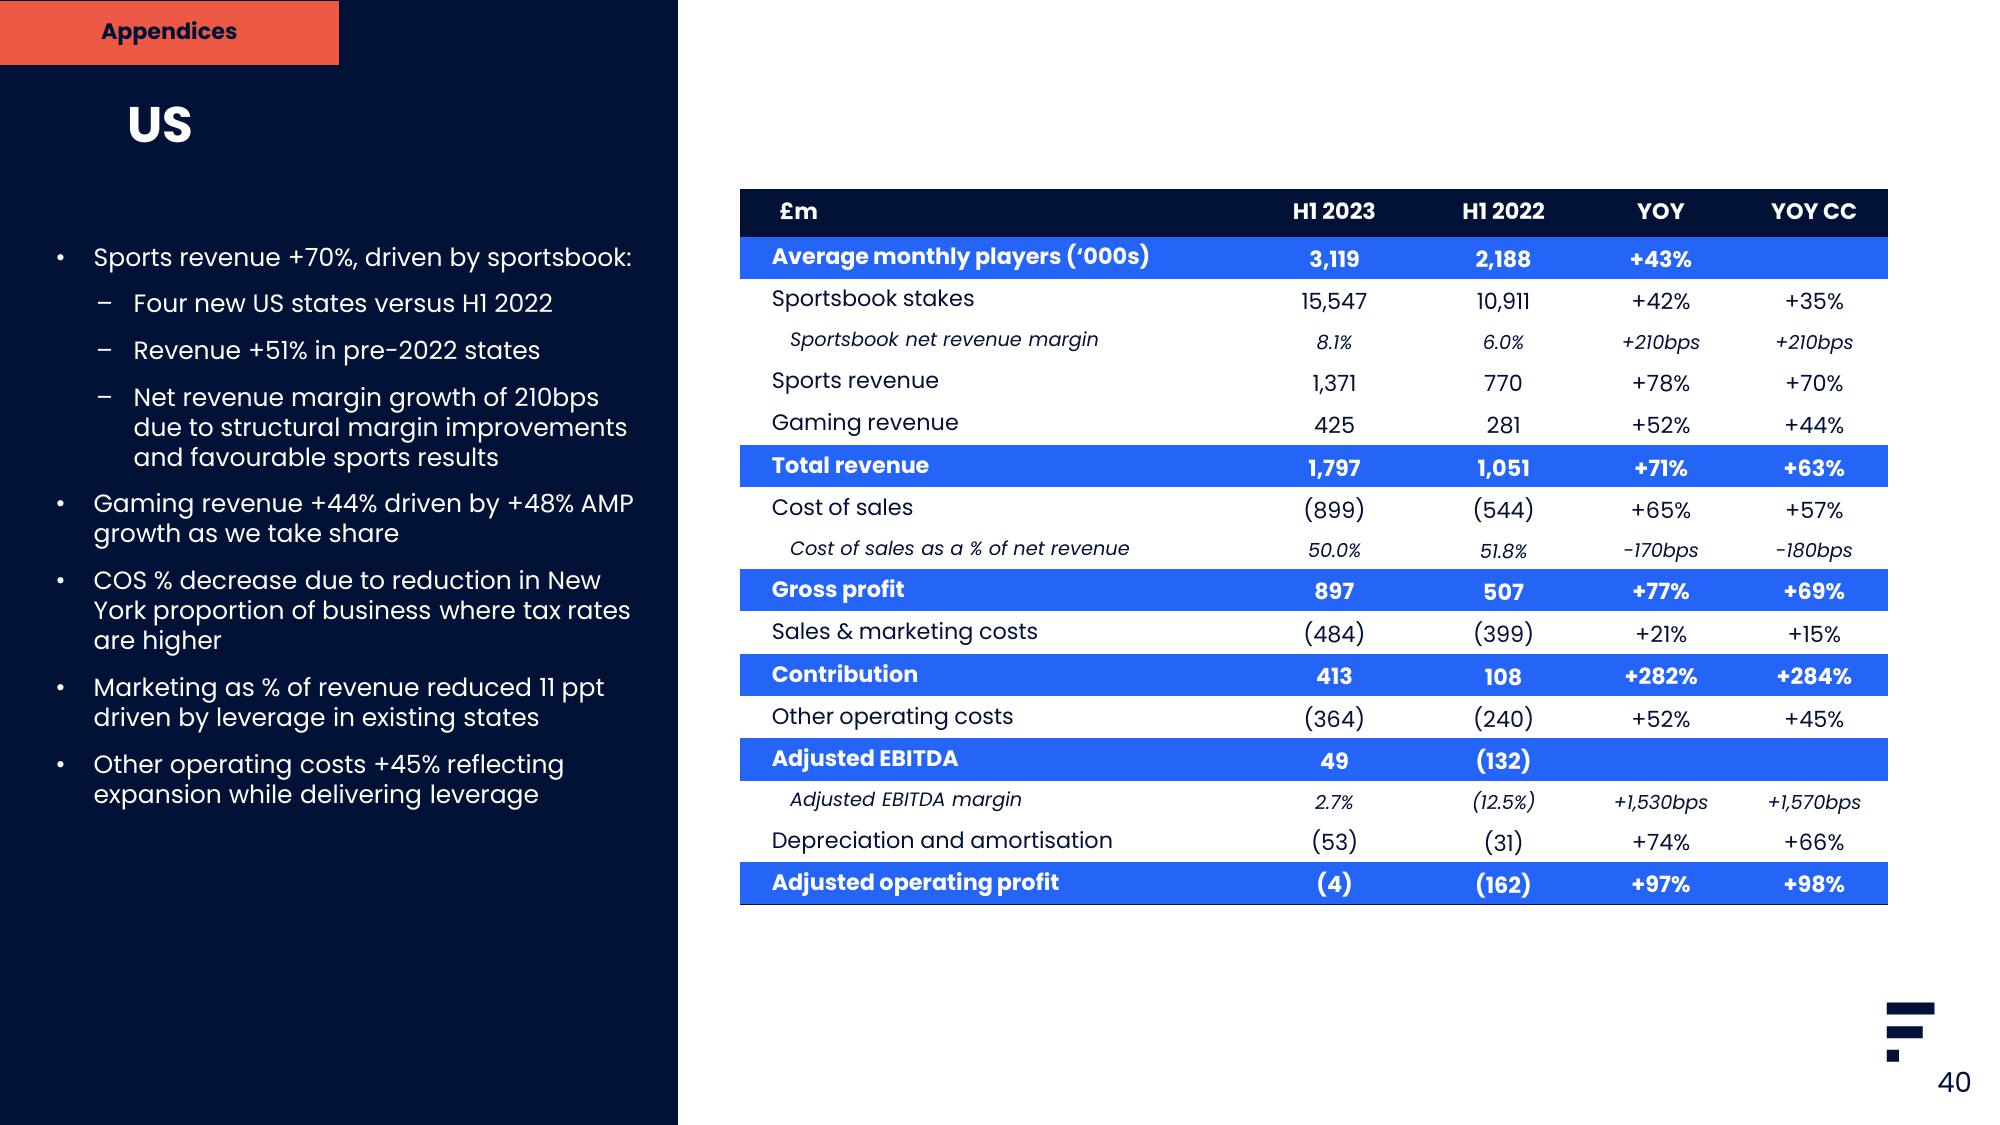
Sports revenue +70%, driven by sportsbook:
Four new US states versus H1 2022
Revenue +51% in pre-2022 states
Net revenue margin growth of 210bps
due to structural margin improvements
and favourable sports results
Gaming revenue +44% driven by +48% AMP
growth as we take share
COS % decrease due to reduction in New
York proportion of business where tax rates
are higher
Marketing as % of revenue reduced 11 ppt
driven by leverage in existing states
Other operating costs +45% reflecting
expansion while delivering leverage
£m
Average monthly players ('000s)
Sportsbook stakes
Sportsbook net revenue margin
Sports revenue
Gaming revenue
Total revenue
Cost of sales
Cost of sales as a % of net revenue
Gross profit
Sales & marketing costs
Contribution
Other operating costs
Adjusted EBITDA
Adjusted EBITDA margin
Depreciation and amortisation
Adjusted operating profit
H1 2023
3,119
15,547
8.1%
1,371
425
1,797
(899)
50.0%
897
(484)
413
(364)
49
2.7%
(53)
H12022
2,188
10,911
6.0%
770
281
1,051
(544)
51.8%
507
(399)
108
(240)
(132)
(12.5%)
(31)
(162)
YOY
+43%
+42%
+210bps
+78%
+52%
+71%
+65%
-170bps
+77%
+21%
+282%
+52%
+1,530bps
+74%
+97%
YOY CC
+35%
+210bps
+70%
+44%
+63%
+57%
-180bps
+69%
+15%
+284%
+45%
+1,570bps
+66%
+98%
F
II.
40View entire presentation