dLocal Results Presentation Deck
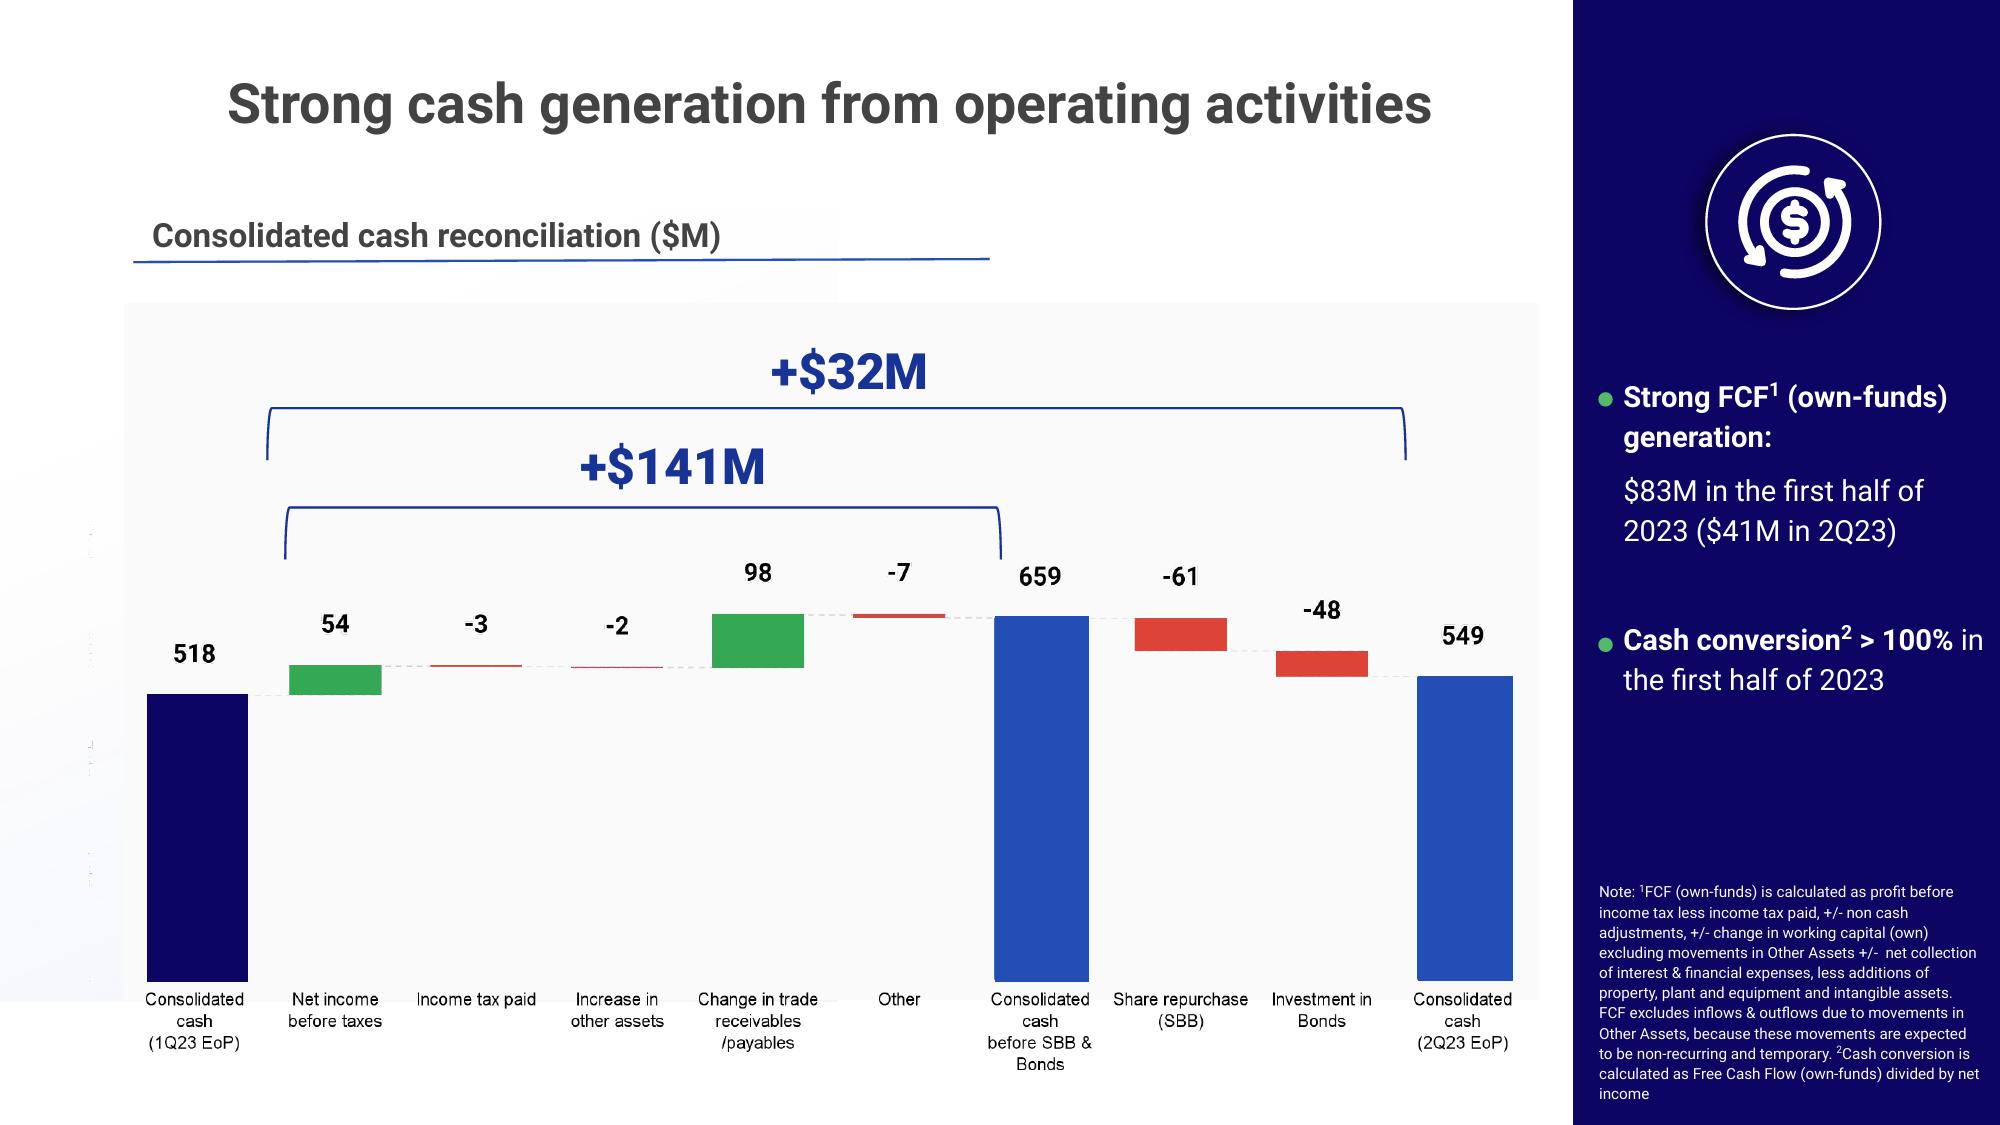
Strong cash generation from operating activities
Consolidated cash reconciliation ($M)
518
Consolidated
cash
(1Q23 EOP)
54
Net income
before taxes
-3
Income tax paid
+$141M
-2
Increase in
other assets
+$32M
98
Change in trade
receivables
/payables
-7
Other
659
-61
-48
Consolidated Share repurchase Investment in
cash
(SBB)
Bonds
before SBB &
Bonds
549
Consolidated
cash
(2Q23 EOP)
Ⓒ
● Strong FCF¹ (own-funds)
generation:
$83M in the first half of
2023 ($41M in 2Q23)
Cash conversion² > 100% in
the first half of 2023
Note: ¹FCF (own-funds) is calculated as profit before
income tax less income tax paid, +/- non cash
adjustments, +/- change in working capital (own)
excluding movements in Other Assets +/- net collection
of interest & financial expenses, less additions of
property, plant and equipment and intangible assets.
FCF excludes inflows & outflows due to movements in
Other Assets, because these movements are expected
to be non-recurring and temporary. 2Cash conversion is
calculated as Free Cash Flow (own-funds) divided by net
incomeView entire presentation