Hydrofarm IPO Presentation Deck
Hydrofarm's strong relationships with a global network of suppliers has created a
meaningful moat around our business
Supplier breakdown
Spend with suppliers by
country
Netherlands
3%
Poland
5%
Canada
16%
Other
9%
China
24%
United States
43%
Suppliers by % of total
supplier costs
9%
7%
5%
4%
4%
3%
CONFIDENTIAL
Commentary
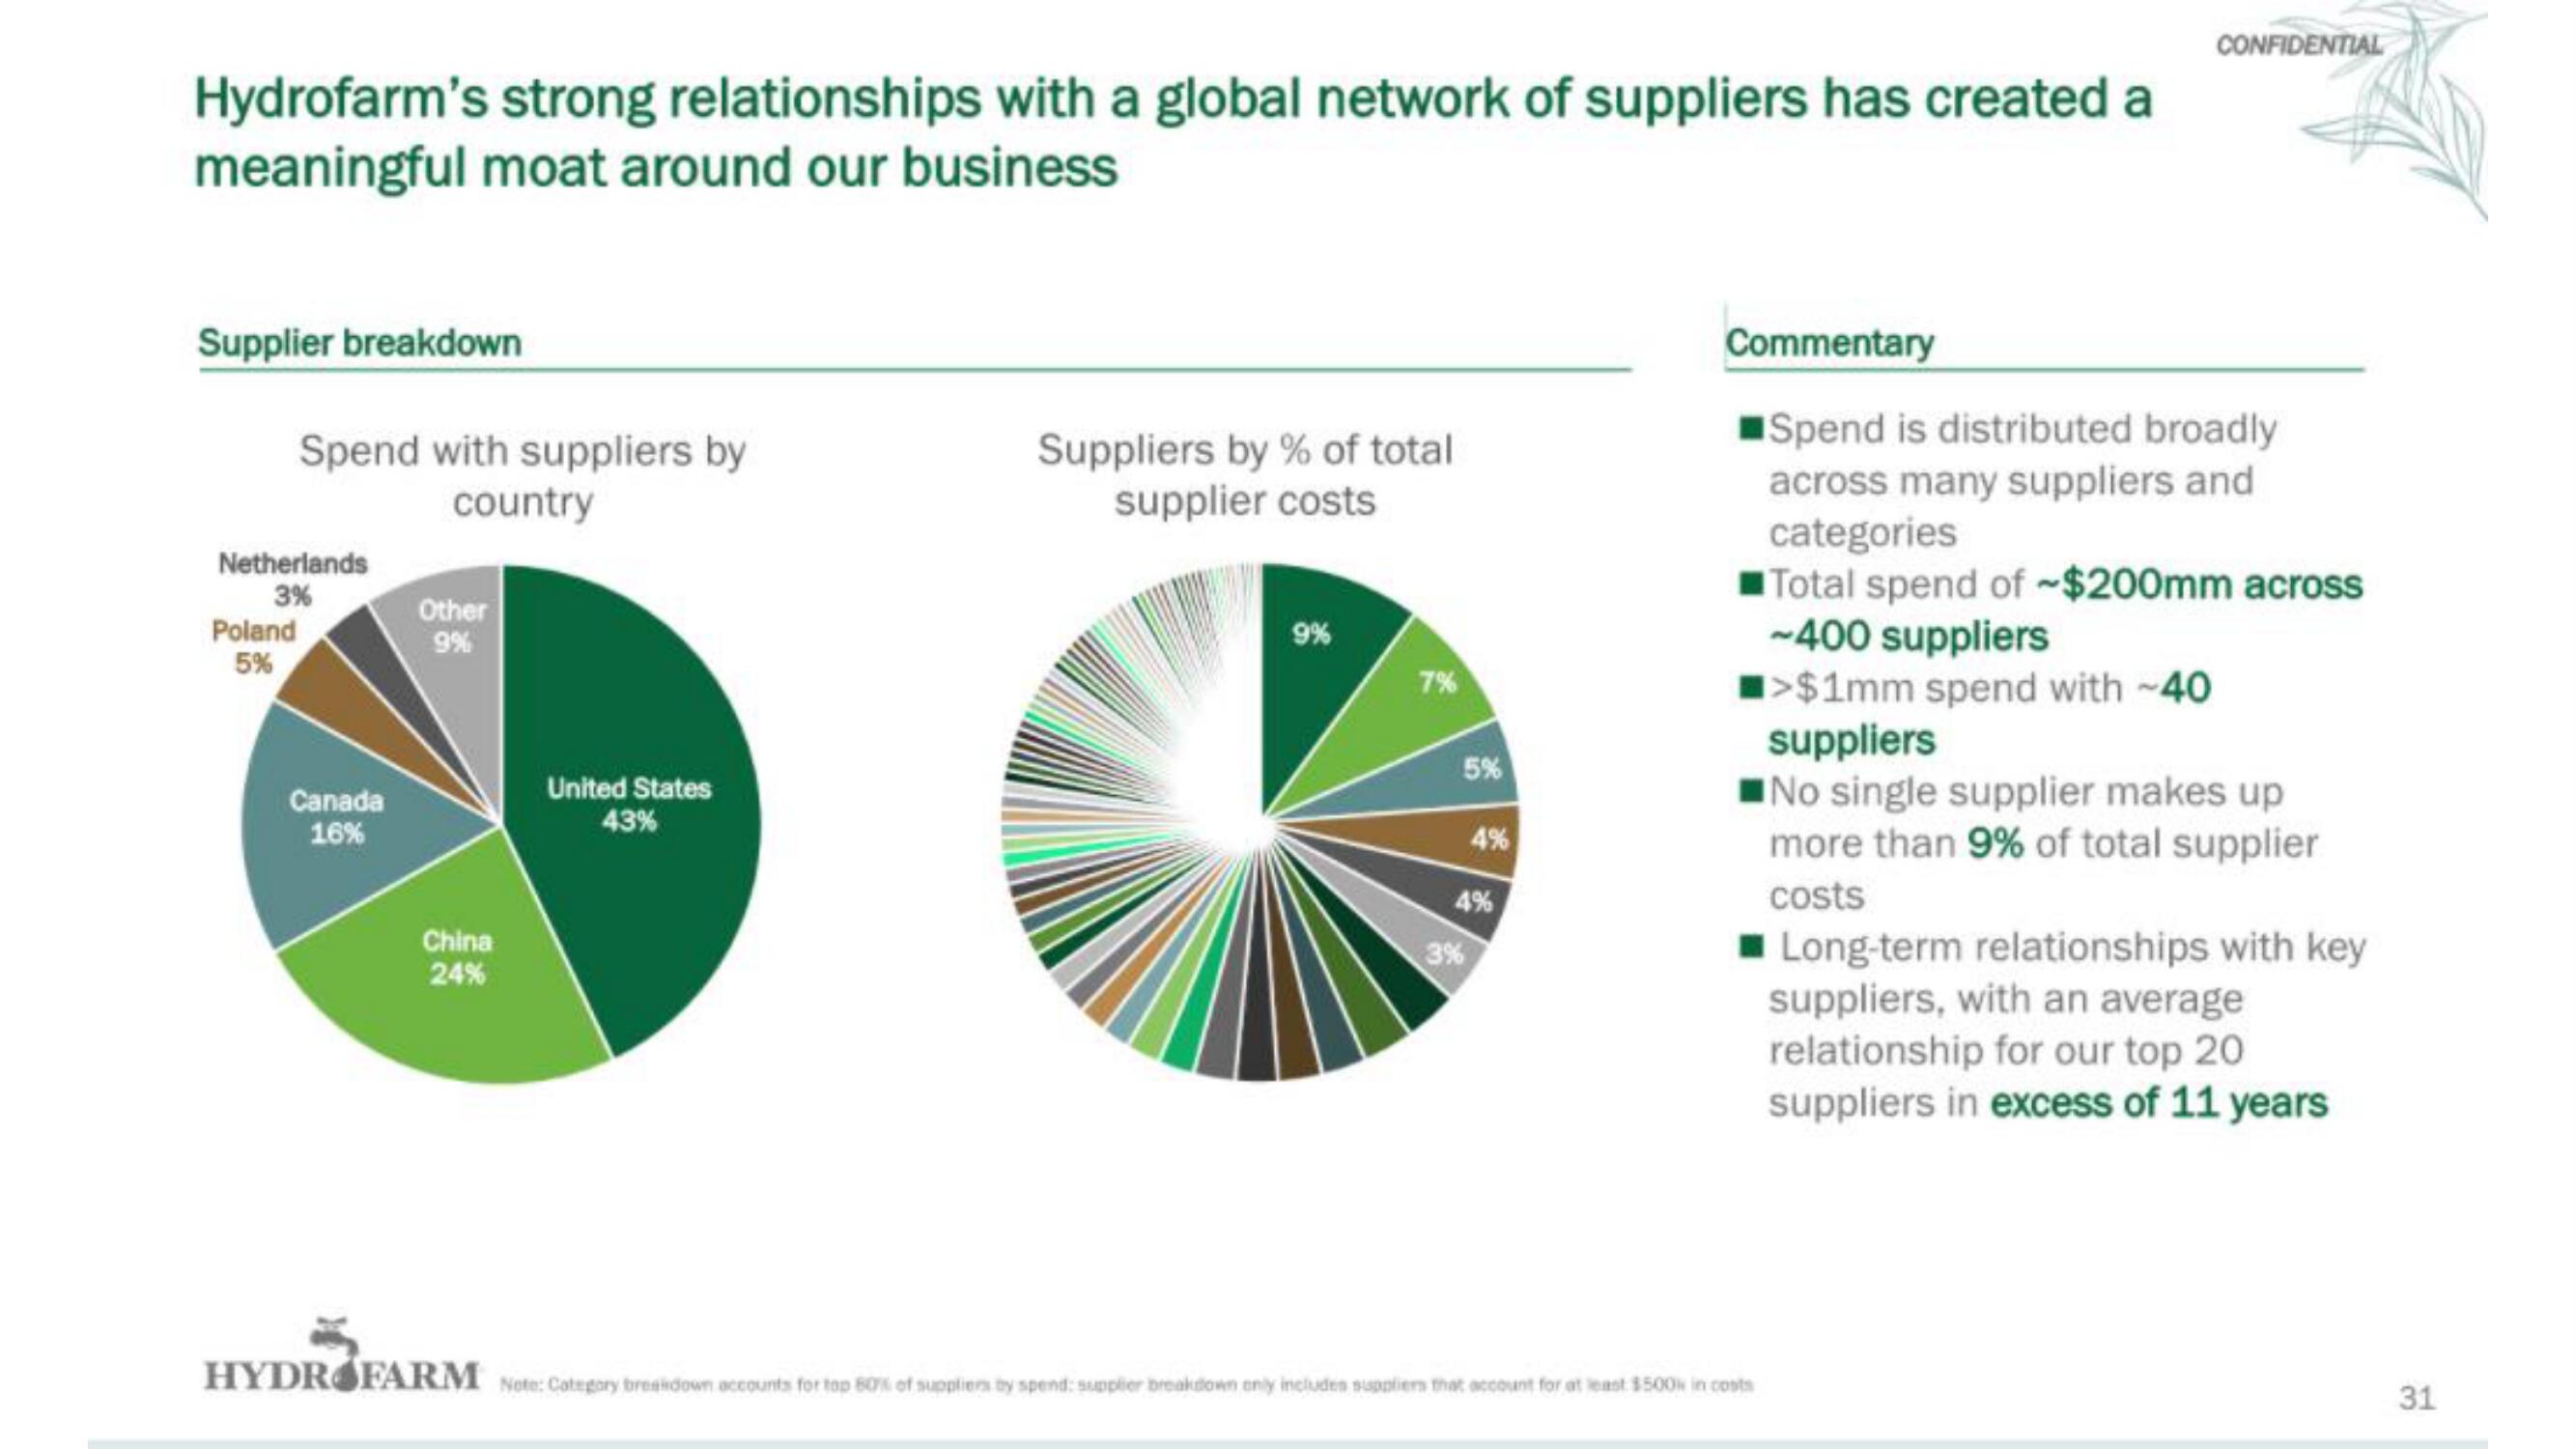
Spend is distributed broadly
across many suppliers and
categories
Total spend of $200mm across
~400 suppliers
■>$1mm spend with ~40
suppliers
No single supplier makes up
more than 9% of total supplier
costs
■Long-term relationships with key
suppliers, with an average
relationship for our top 20
suppliers in excess of 11 years
HYDROFARM Note: Category breakdown accounts for top 80% of suppliers by spend: supplier breakdown only includes suppliers that account for at least $500k in costs
31View entire presentation