Deutsche Bank Results Presentation Deck
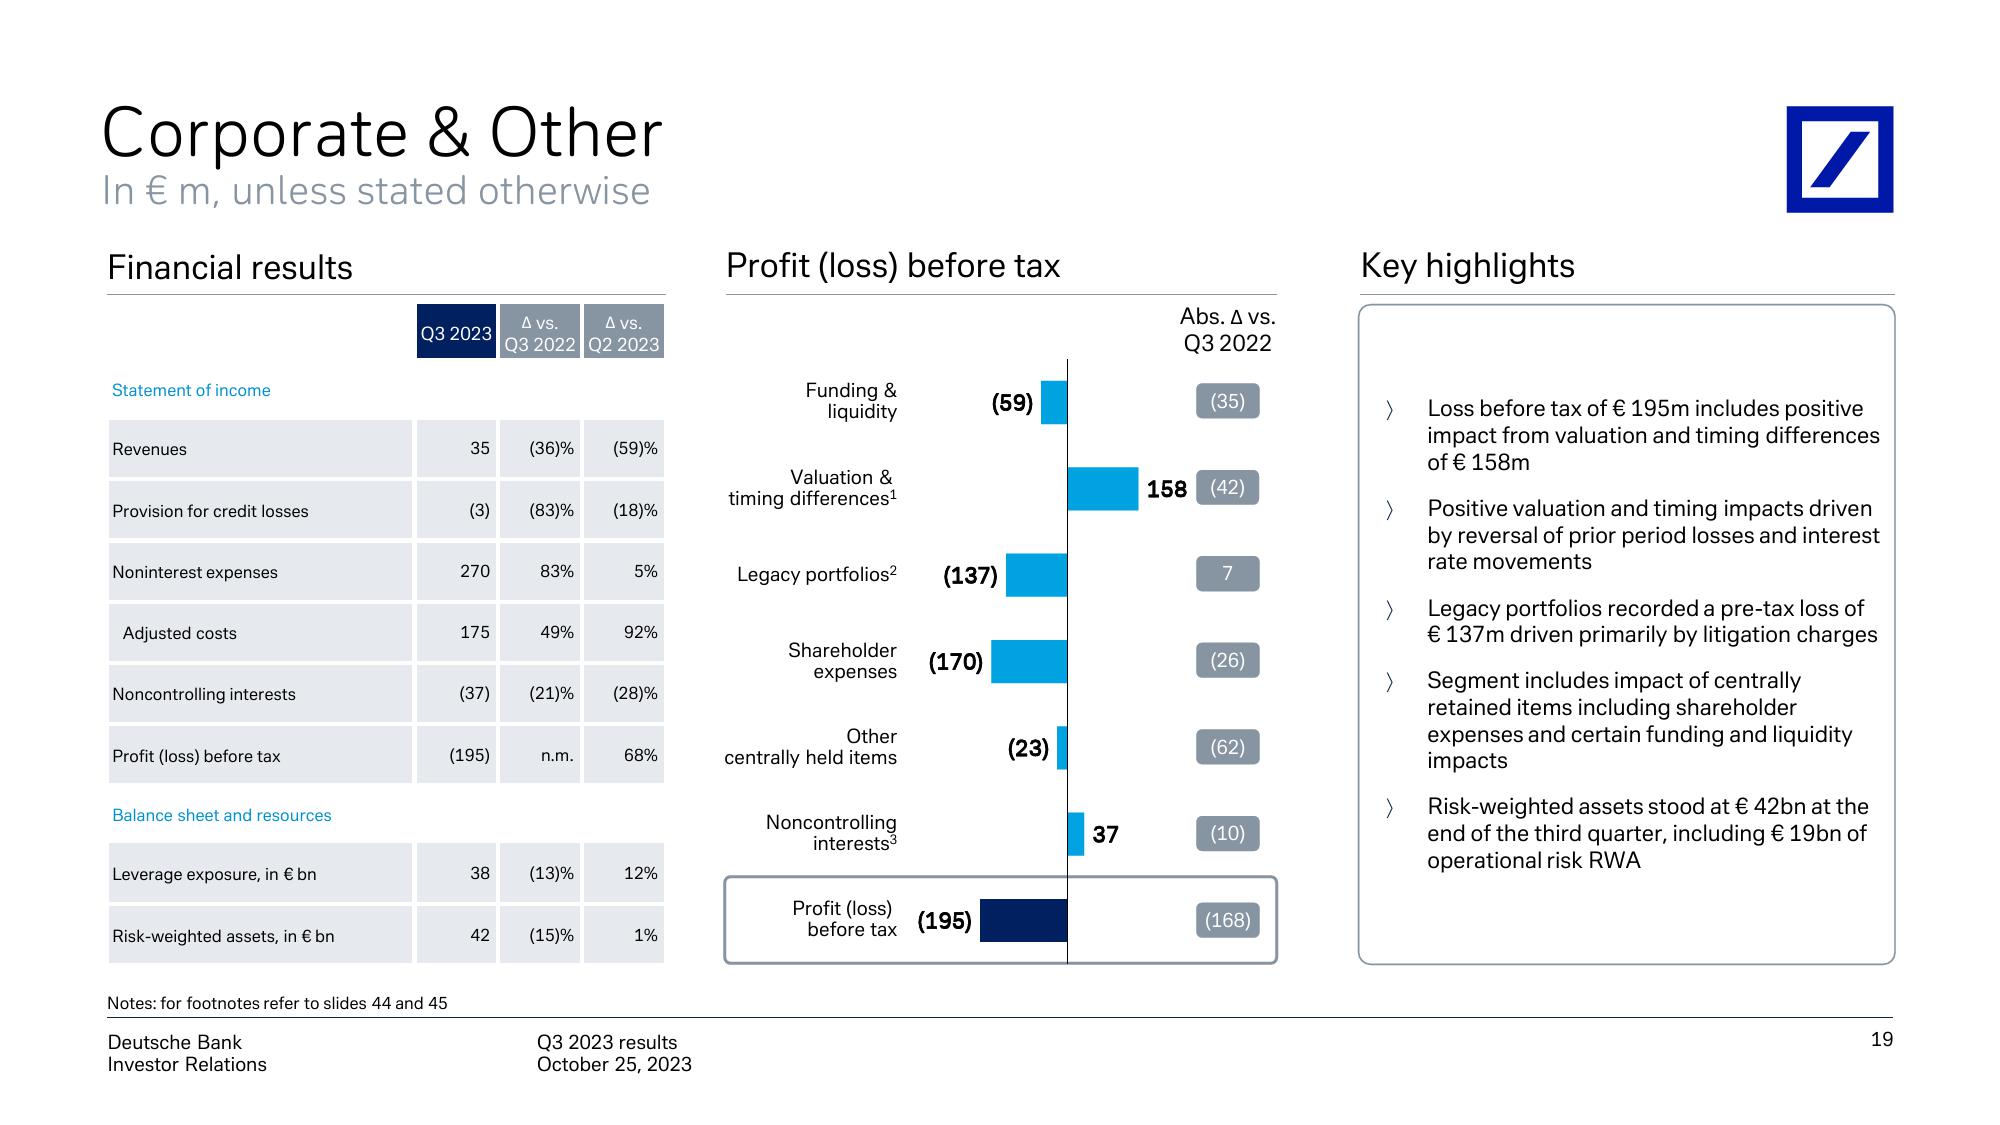
Corporate & Other
In € m, unless stated otherwise
Financial results
Statement of income
Revenues
Provision for credit losses
Noninterest expenses
Adjusted costs
Noncontrolling interests
Profit (loss) before tax
Balance sheet and resources
Leverage exposure, in € bn
Risk-weighted assets, in € bn
Q3 2023
35
Notes: for footnotes refer to slides 44 and 45
Deutsche Bank
Investor Relations
(3)
270
175
(195)
A vs.
A vs.
Q3 2022 Q2 2023
(36)%
42
(83)%
83%
49%
n.m.
38 (13)%
(37) (21)% (28)%
(59)%
(15)%
(18)%
5%
92%
68%
12%
1%
Q3 2023 results
October 25, 2023
Profit (loss) before tax
Funding &
liquidity
Valuation &
timing differences¹
Legacy portfolios²
Shareholder
expenses
Other
centrally held items
Noncontrolling
interests³
Profit (loss)
before tax
(137)
(170)
(59)
(195)
(23)
37
Abs. A vs.
Q3 2022
(35)
158 (42)
7
(26)
(62)
(10)
(168)
Key highlights
/
Loss before tax of € 195m includes positive
impact from valuation and timing differences
of € 158m
Positive valuation and timing impacts driven
by reversal of prior period losses and interest
rate movements
Legacy portfolios recorded a pre-tax loss of
€ 137m driven primarily by litigation charges
Segment includes impact of centrally
retained items including shareholder
expenses and certain funding and liquidity
impacts
Risk-weighted assets stood at € 42bn at the
end of the third quarter, including € 19bn of
operational risk RWA
19View entire presentation