Hypebeast Results Presentation Deck
r
HK$
Hypebeast Ltd. 150.HK
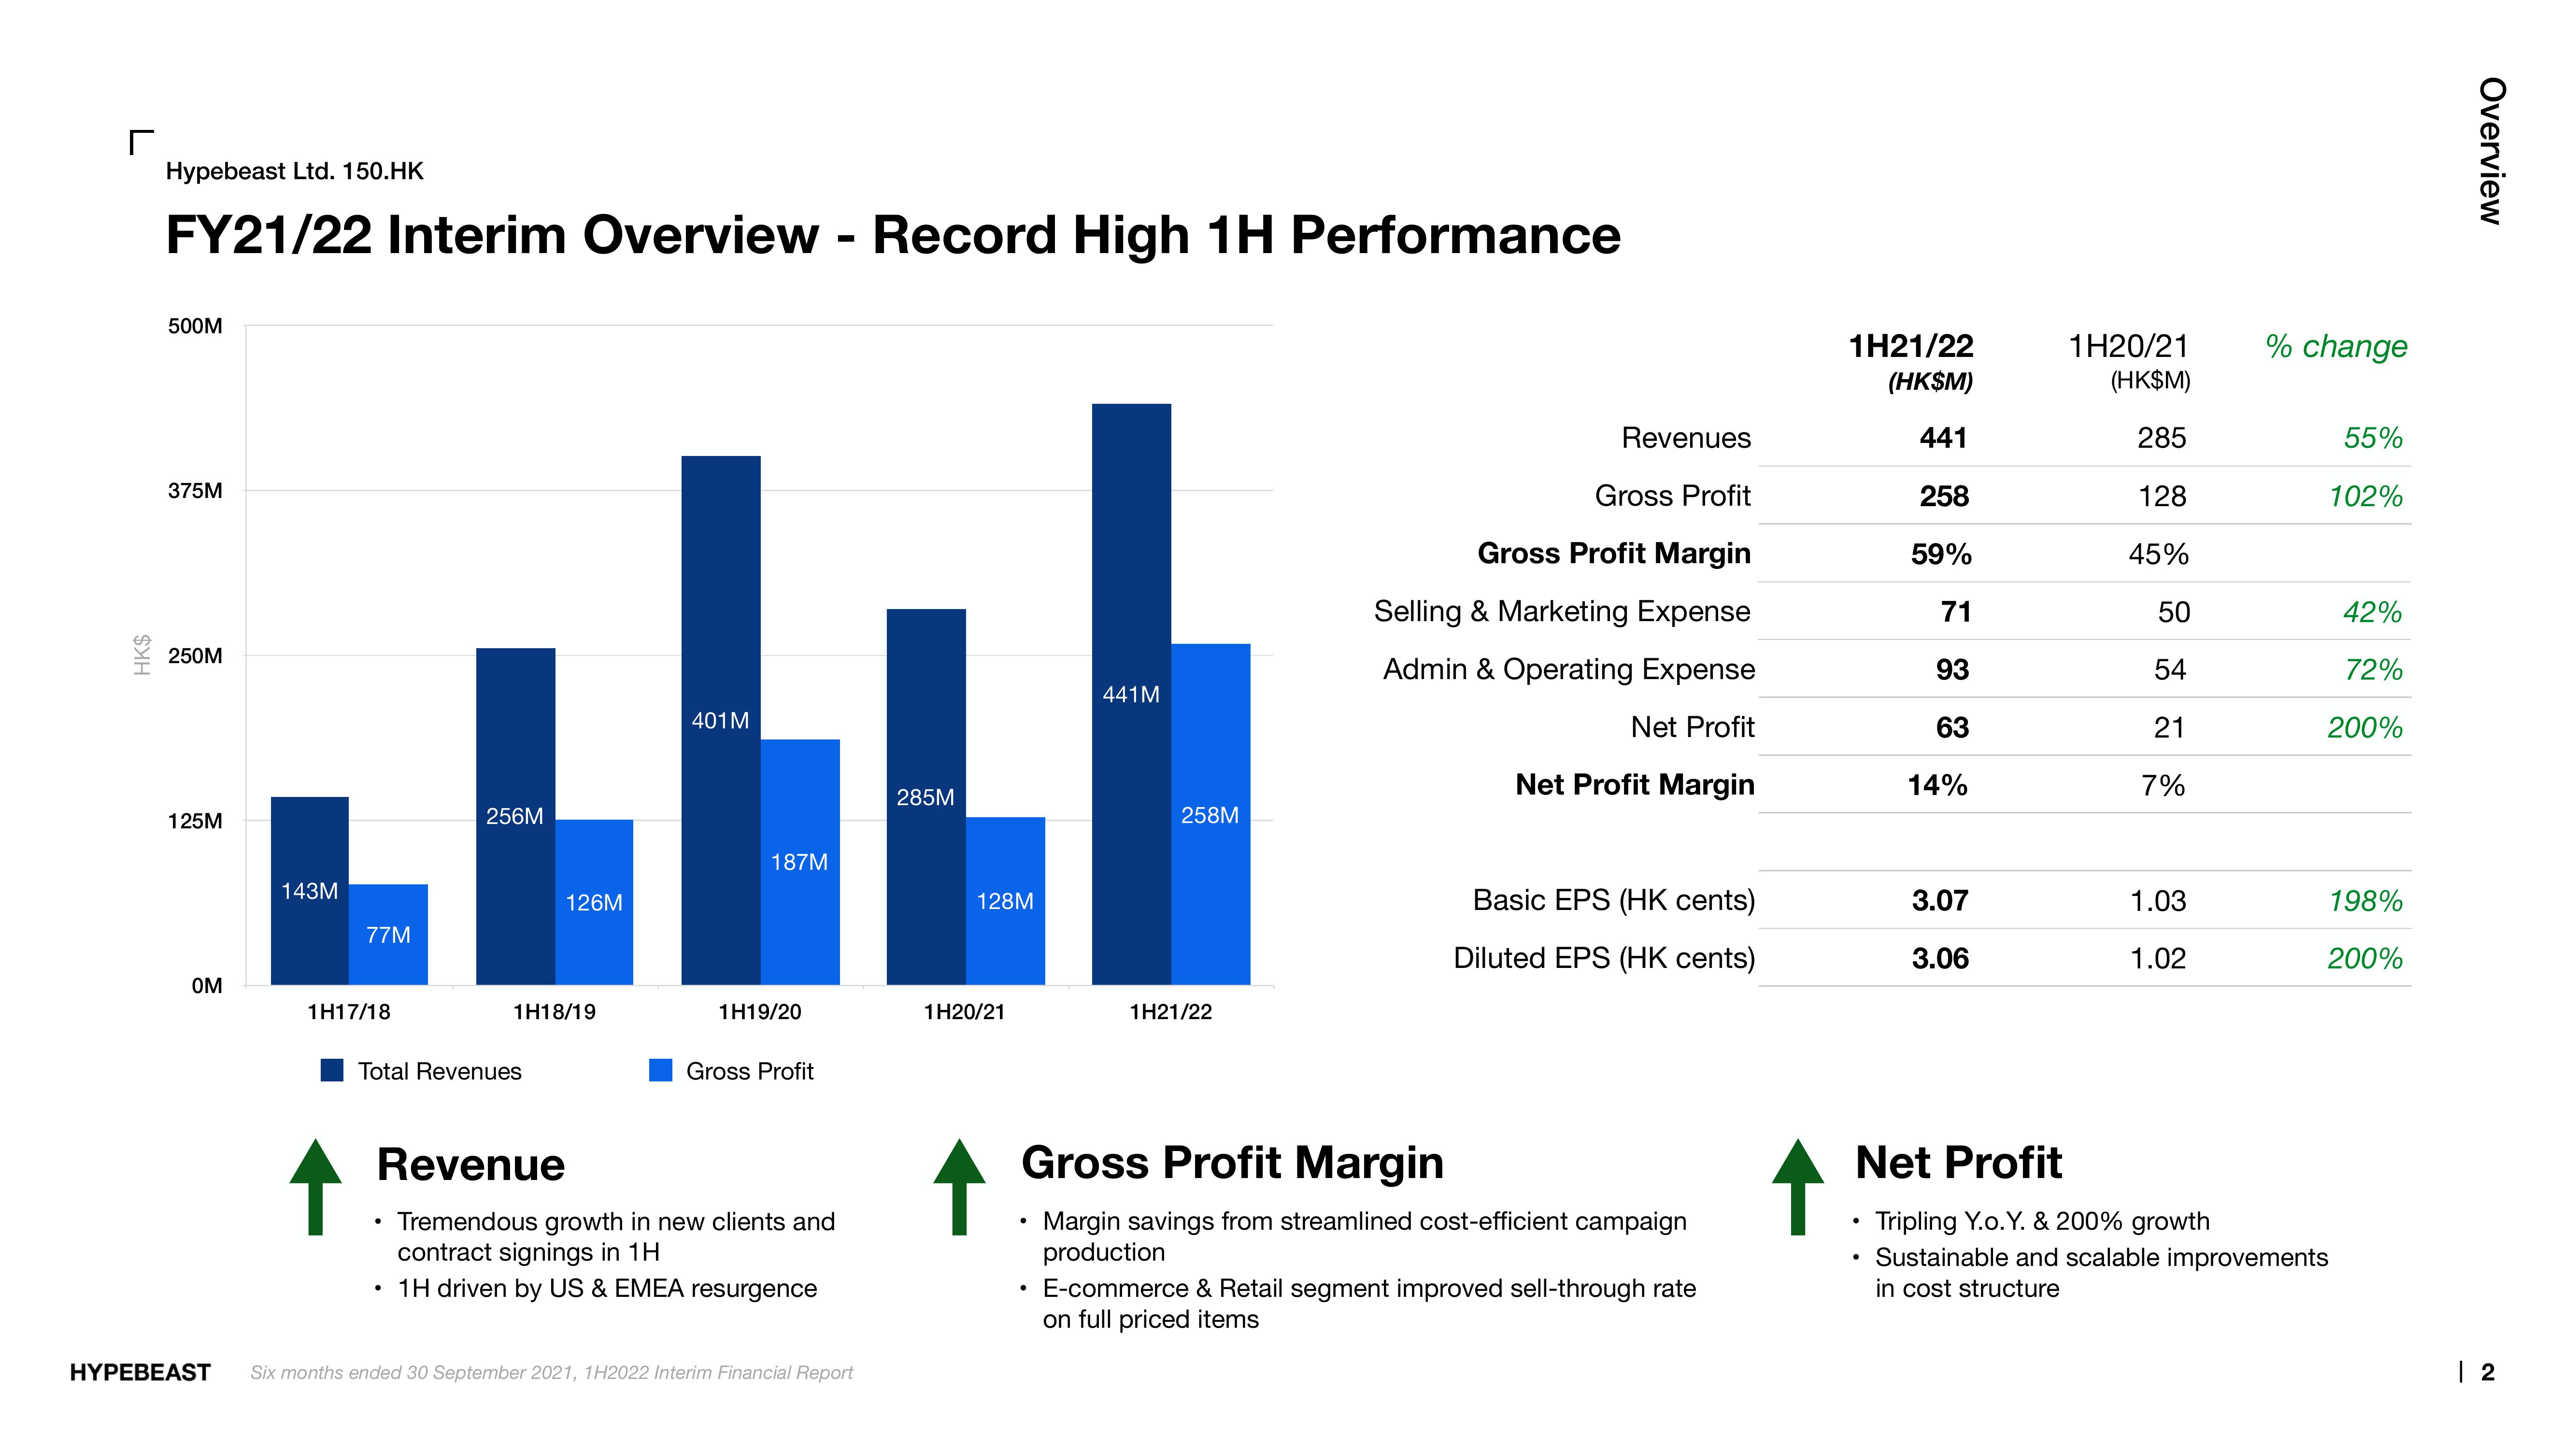
FY21/22 Interim Overview - Record High 1H Performance
500M
375M
250M
125M
OM
HYPEBEAST
143M
77M
1H17/18
↑
256M
Total Revenues
.
126M
1H18/19
401 M
187M
1H19/20
Gross Profit
Revenue
Tremendous growth in new clients and
contract signings in 1H
• 1H driven by US & EMEA resurgence
Six months ended 30 September 2021, 1H2022 Interim Financial Report
285M
128M
1H20/21
441M
258M
1H21/22
Revenues
Gross Profit
Gross Profit Margin
Selling & Marketing Expense
Admin & Operating Expense
Net Profit
Net Profit Margin
Basic EPS (HK cents)
Diluted EPS (HK cents)
Gross Profit Margin
Margin savings from streamlined cost-efficient campaign
production
• E-commerce & Retail segment improved sell-through rate
on full priced items
↑
1H21/22
(HK$M)
441
258
59%
71
93
63
14%
3.07
3.06
.
1H20/21
(HK$M)
285
128
45%
50
54
21
7%
1.03
1.02
% change
55%
102%
42%
72%
200%
Net Profit
Tripling Y.o.Y. & 200% growth
Sustainable and scalable improvements
in cost structure
198%
200%
Overview
12View entire presentation