Kore Results Presentation Deck
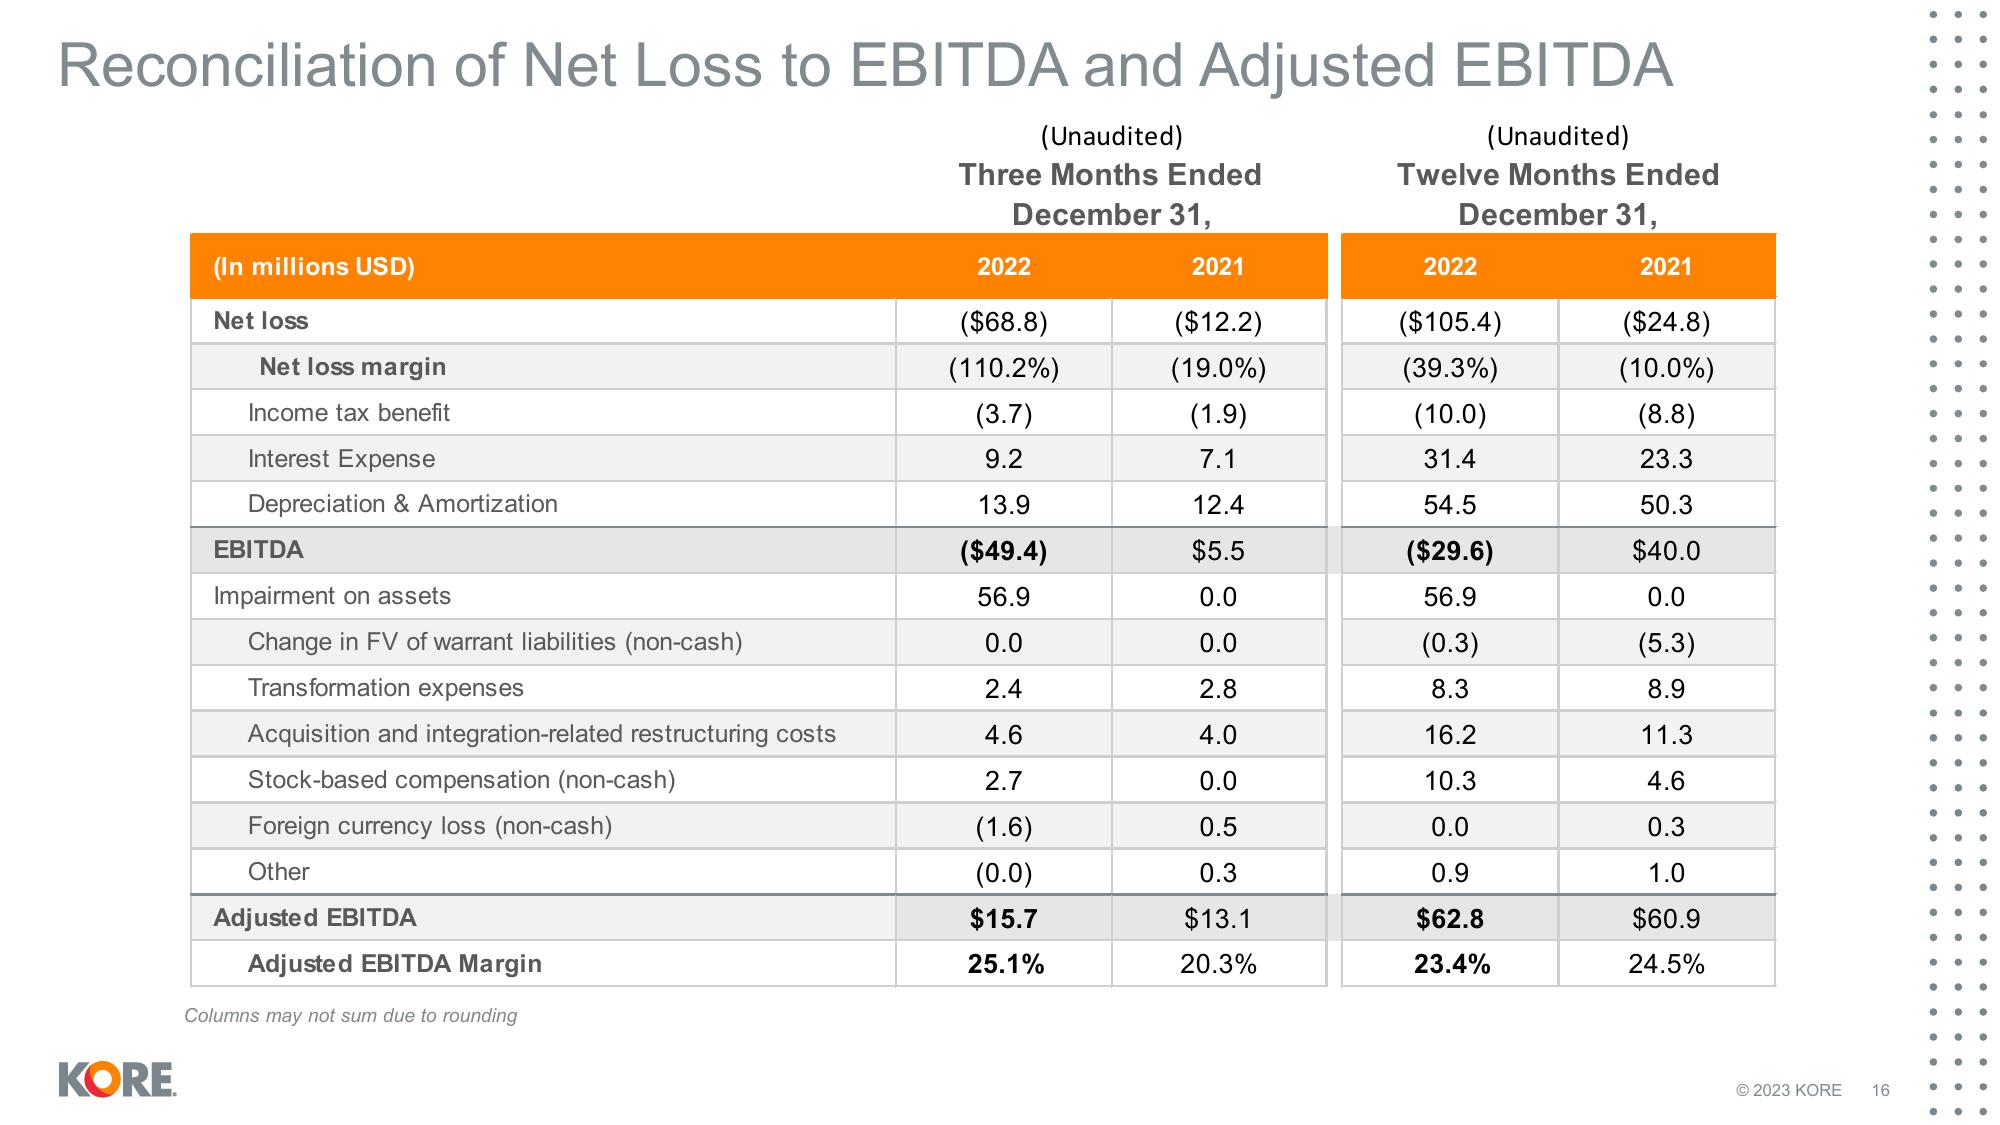
Reconciliation of Net Loss to EBITDA and Adjusted EBITDA
(Unaudited)
Twelve Months Ended
December 31,
2021
($24.8)
(10.0%)
(8.8)
23.3
50.3
$40.0
0.0
(5.3)
8.9
11.3
4.6
0.3
1.0
$60.9
24.5%
KORE
(In millions USD)
Net loss
Net loss margin
Income tax benefit
Interest Expense
Depreciation & Amortization
EBITDA
Impairment on assets
Change in FV of warrant liabilities (non-cash)
Transformation expenses
Acquisition and integration-related restructuring costs
Stock-based compensation (non-cash)
Foreign currency loss (non-cash)
Other
Adjusted EBITDA
Adjusted EBITDA Margin
Columns may not sum due to rounding
(Unaudited)
Three Months Ended
December 31,
2022
($68.8)
(110.2%)
(3.7)
9.2
13.9
($49.4)
56.9
0.0
2.4
4.6
2.7
(1.6)
(0.0)
$15.7
25.1%
2021
($12.2)
(19.0%)
(1.9)
7.1
12.4
$5.5
0.0
0.0
2.8
4.0
0.0
0.5
0.3
$13.1
20.3%
2022
($105.4)
(39.3%)
(10.0)
31.4
54.5
($29.6)
56.9
(0.3)
8.3
16.2
10.3
0.0
0.9
$62.8
23.4%
© 2023 KORE 16
●
..
●
•
●
●
● ●
●
●
.
● ●
..
●
●
●
● ●
●
●
● •
● ●
●
e
● ●
...
●● ●
● ●
● ●View entire presentation