Hilltop Holdings Results Presentation Deck
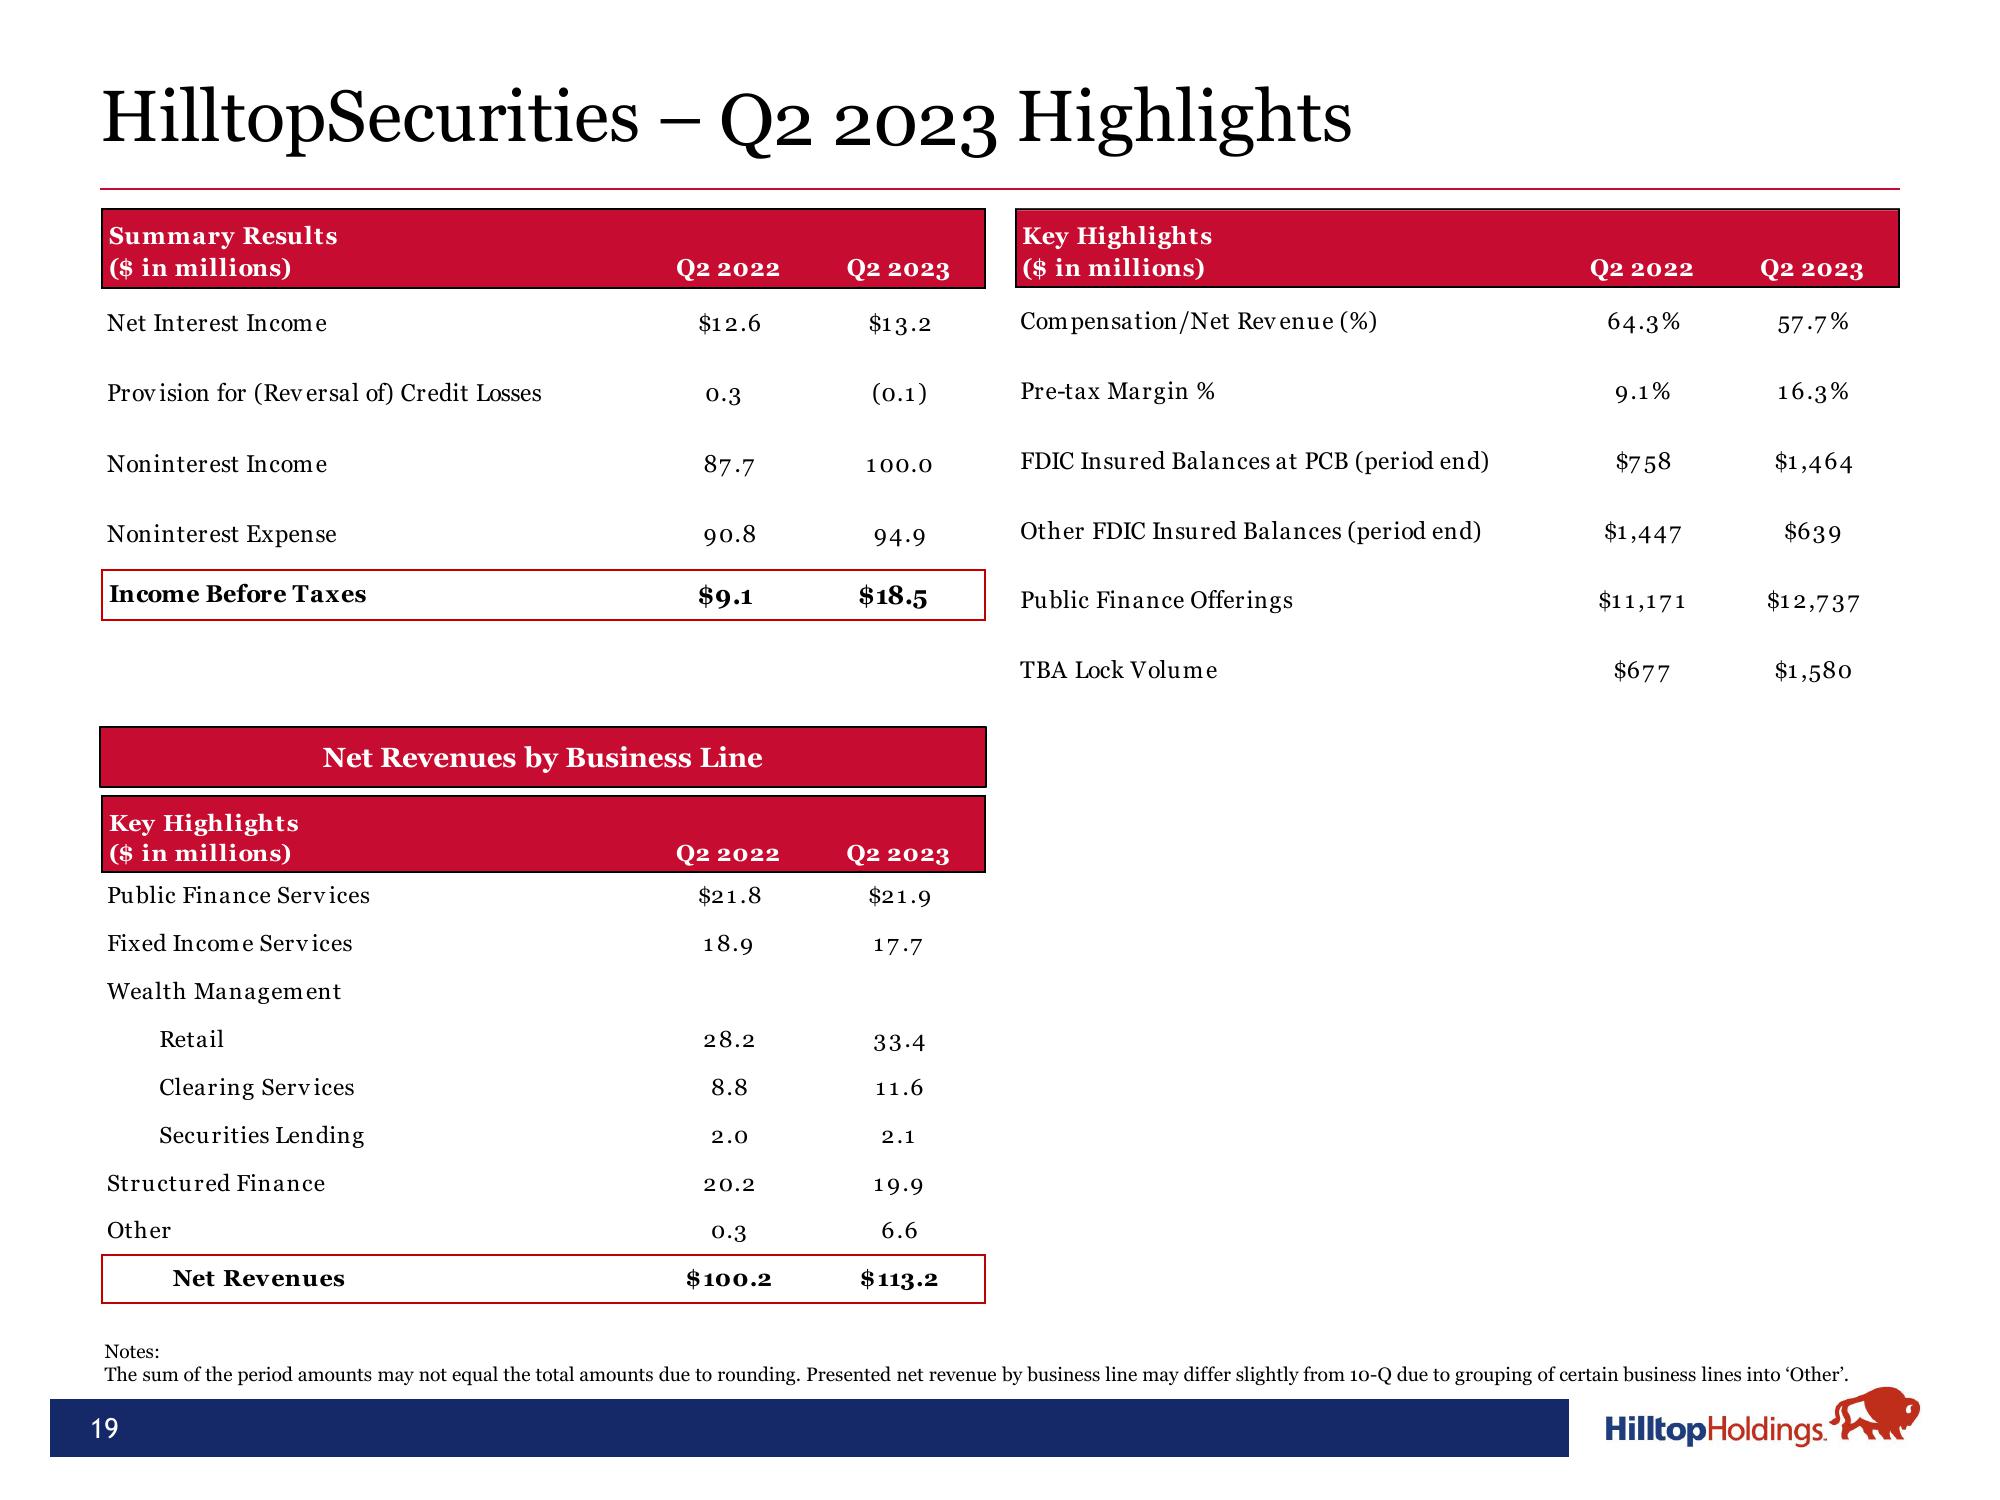
HilltopSecurities – Q2 2023 Highlights
-
Summary Results
($ in millions)
Net Interest Income
Provision for (Reversal of) Credit Losses
Noninterest Income
Noninterest Expense
Income Before Taxes
Key Highlights
($ in millions)
Public Finance Services
Fixed Income Services
Wealth Management
Retail
Clearing Services
Securities Lending
Structured Finance
Other
Q2 2022
Net Revenues
$12.6
0.3
Net Revenues by Business Line
87.7
90.8
$9.1
Q2 2022
$21.8
18.9
28.2
8.8
2.0
20.2
0.3
$100.2
Q2 2023
$13.2
(0.1)
100.0
94.9
$18.5
Q2 2023
$21.9
17.7
33.4
11.6
2.1
19.9
6.6
$113.2
Key Highlights
($ in millions)
Compensation/Net Revenue (%)
Pre-tax Margin %
FDIC Insured Balances at PCB (period end)
Other FDIC Insured Balances (period end)
Public Finance Offerings
TBA Lock Volume
Q2 2022
64.3%
9.1%
$758
$1,447
$11,171
$677
Q2 2023
57.7%
16.3%
$1,464
$639
$12,737
$1,580
Notes:
The sum of the period amounts may not equal the total amounts due to rounding. Presented net revenue by business line may differ slightly from 10-Q due to grouping of certain business lines into 'Other'.
19
Hilltop Holdings.View entire presentation