Deliveroo Investor Event Presentation Deck slide image

Deliveroo Investor Event Presentation Deck

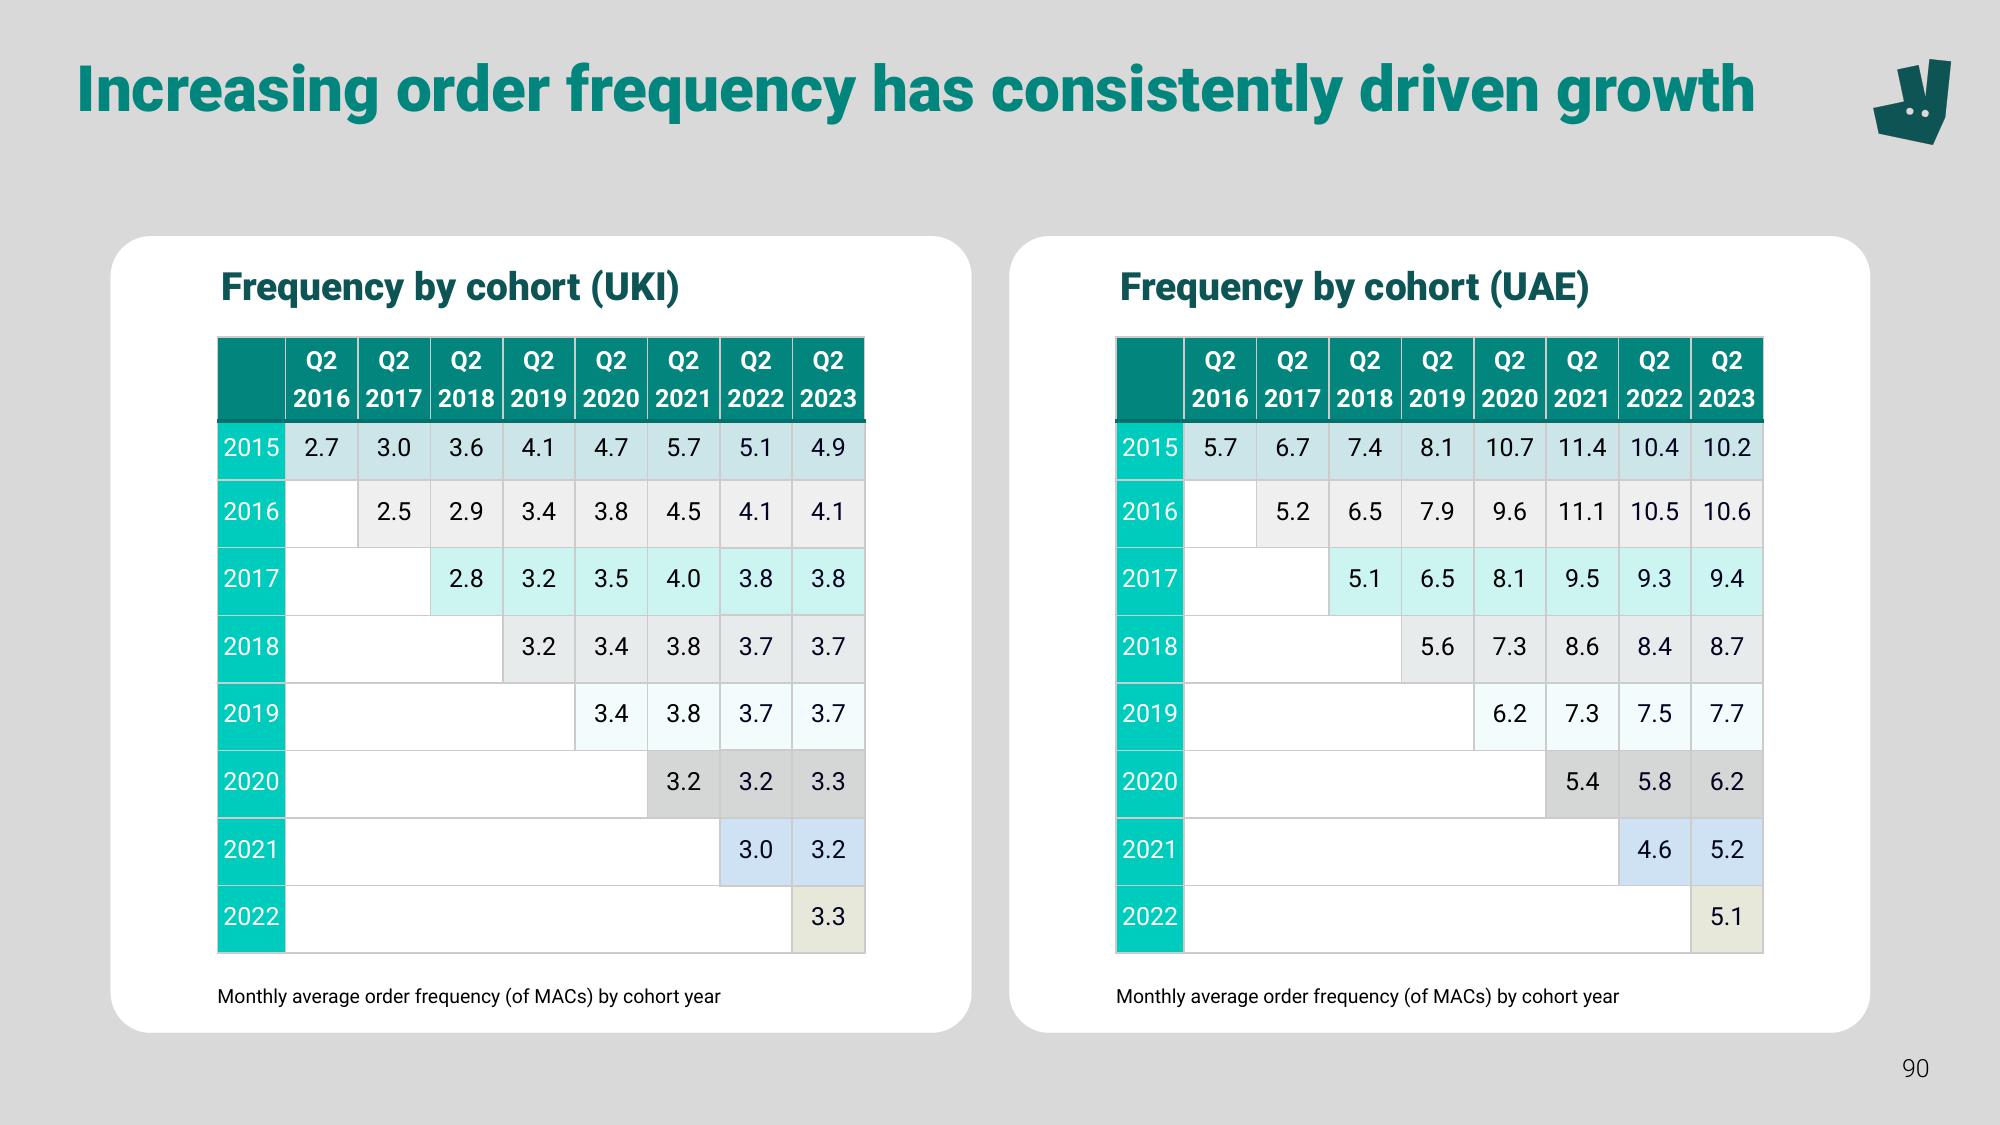
Increasing order frequency has consistently driven growth Frequency by cohort (UKI) Q2 Q2 Q2 Q2 Q2 Q2 Q2 Q2 2016 2017 2018 2019 2022 2023 2020 2021 4.7 5.7 5.1 2015 2.7 3.0 3.6 4.1 4.9 2016 2017 2018 2019 2020 2021 2022 2.5 2.9 3.4 3.8 4.5 4.1 2.8 3.2 3.5 4.0 3.8 3.8 3.2 3.4 3.4 3.8 3.7 4.1 3.7 3.8 3.7 3.7 Monthly average order frequency (of MACs) by cohort year 3.2 3.2 3.3 3.0 3.2 3.3 Frequency by cohort (UAE) 2015 5.7 6.7 7.4 2016 2017 2018 2019 2020 2021 Q2 Q2 Q2 Q2 Q2 Q2 Q2 Q2 2016 2017 2018 2019 2020 2021 2022 2023 8.1 10.7 11.4 10.4 10.2 2022 5.2 6.5 5.1 7.9 9.6 11.1 10.5 10.6 6.5 8.1 5.6 7.3 6.2 9.5 9.3 9.4 8.6 8.4 8.7 7.3 7.5 7.7 5.4 5.8 Monthly average order frequency (of MACs) by cohort year 4.6 6.2 5.2 5.1 ā†’ 90
View entire presentation