J.P.Morgan Results Presentation Deck
JPMORGAN CHASE & CO.
CONSUMER & COMMUNITY BANKING
FINANCIAL HIGHLIGHTS, CONTINUED
(in millions, except headcount data)
SELECTED BALANCE SHEET DATA (period-end)
Total assets
Loans:
Consumer & Business Banking (a)
Home Lending (b)
Card
Auto
Total loans
Deposits
Equity
SELECTED BALANCE SHEET DATA (average)
Total assets
Loans:
Consumer & Business Banking
Home Lending (c)
Card
Auto
Total loans
Deposits
Equity
Headcount
2Q22
$ 500,219
$
31,494
176,939
165,494
67,842
441,769
1,178,825
50,000
496,177
32,294
177,330
158,434
68,569
436,627
1,180,453
50,000
130,907
1Q22
$ 486,183
32,772
172,025
152,283
69,251
426,331
1,189,308
50,000
$ 488,967
33,742
176,488
149,398
69,250
428,878
1,153,513
50,000
129,268
4Q21
QUARTERLY TRENDS
$ 500,370
35,095
180,529
154,296
69,138
439,058
1,148,110
50,000
$ 497,675
37,299
183,343
148,471
68,549
437,662
1,114,329
50,000
128,863
$
$
3Q21
493,169
40,659
179,489
143,166
68,391
431,705
1,093,852
50,000
491,512
43,256
181,150
141,950
67,785
434,141
1,076,323
50,000
126,586
$
2Q21
494,305
46,228
179,371
141,802
67,598
434,999
1,056,507
50,000
$ 485,209
49,356
177,444
136,149
67,183
430,132
1,047,771
50,000
125,300
2Q22 Change
1Q22
3%
(4)
3
9
(2)
4
(1)
1
1
(4)
|
6
(1)
2
2
1
JPMORGAN CHASE & Co.
2Q21
1%
(32)
(1)
17
2
12
2
(35)
16
2
2
13
4
$
2022
SIX MONTHS ENDED JUNE 30,
500,219
31,494
176,939
165,494
67,842
441,769
1,178,825
50,000
$ 492,592
33,014
176,911
153,941
68,908
432,774
1,167,057
50,000
130,907
$
2021
494,305
46,228
179,371
141,802
67,598
434,999
1,056,507
50,000
$ 484,868
49,611
179,832
135,520
67,072
432,035
1,013,917
50,000
125,300
2022 Change
2021
1%
(32)
(1)
17
2
12
2
(33)
(2)
14
3
15
4
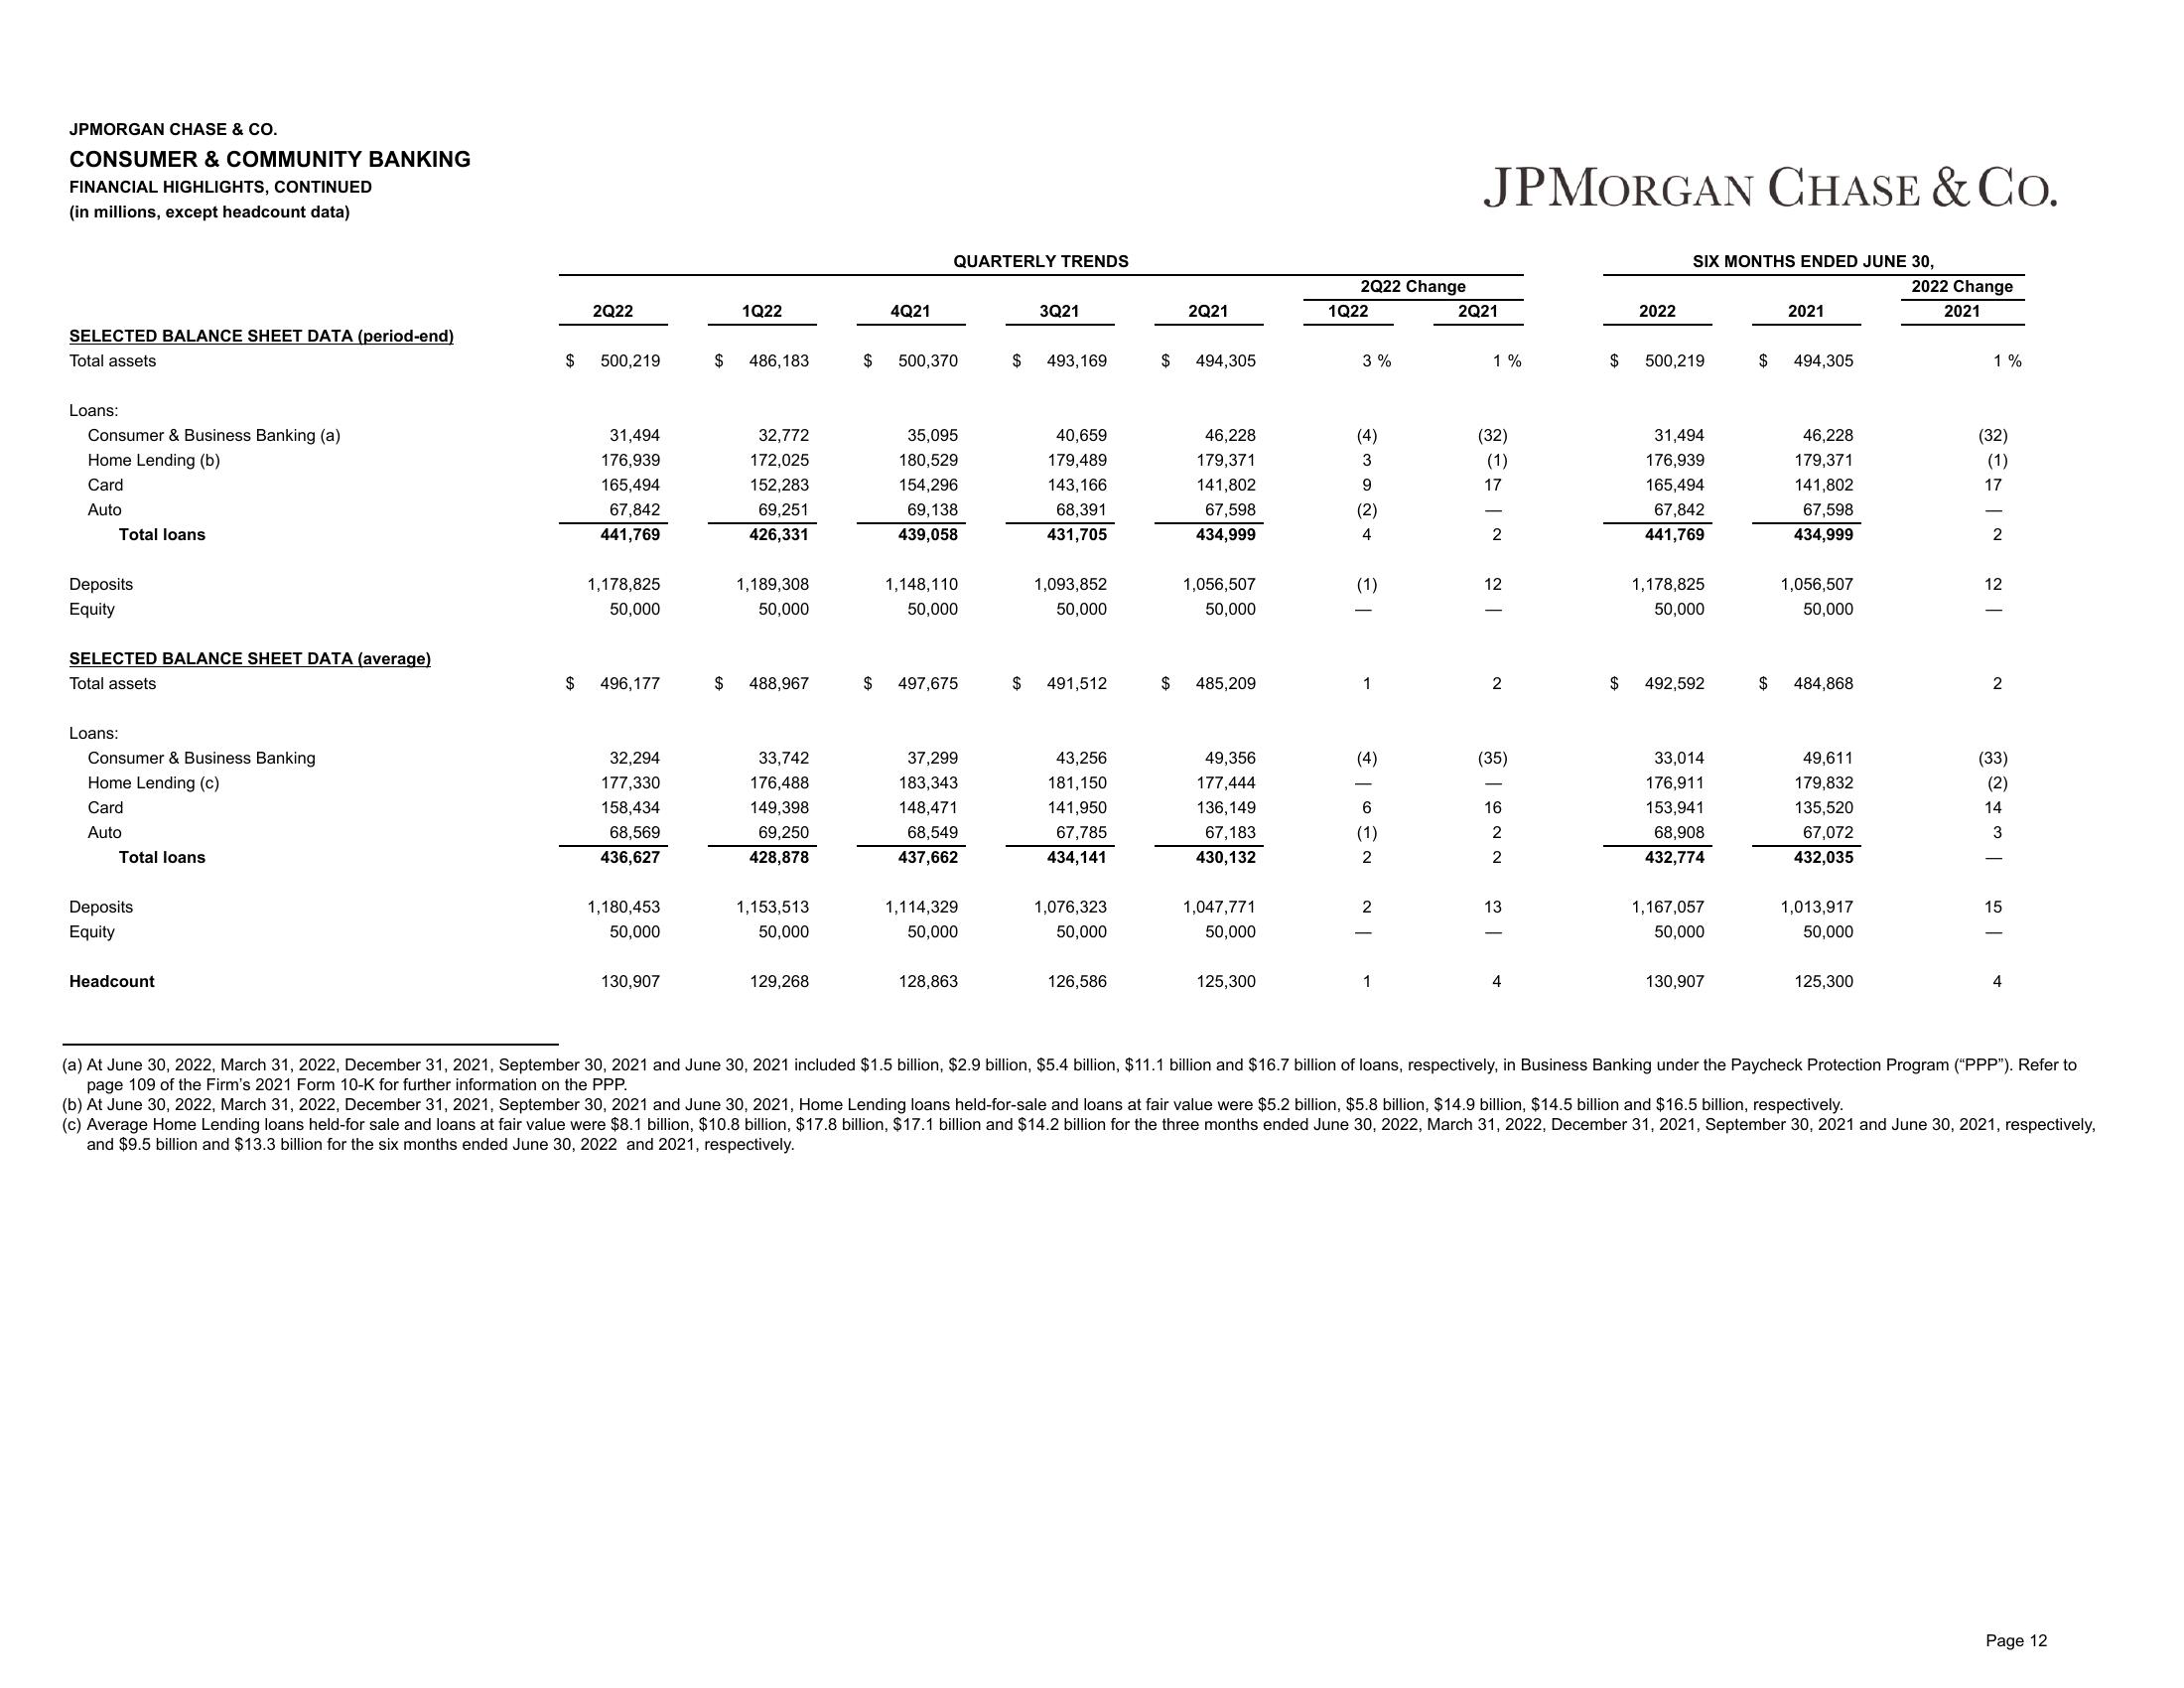
(a) At June 30, 2022, March 31, 2022, December 31, 2021, September 30, 2021 and June 30, 2021 included $1.5 billion, $2.9 billion, $5.4 billion, $11.1 billion and $16.7 billion of loans, respectively, in Business Banking under the Paycheck Protection Program ("PPP"). Refer to
page 109 of the Firm's 2021 Form 10-K for further information on the PPP.
(b) At June 30, 2022, March 31, 2022, December 31, 2021, September 30, 2021 and June 30, 2021, Home Lending loans held-for-sale and loans at fair value were $5.2 billion, $5.8 billion, $14.9 billion, $14.5 billion and $16.5 billion, respectively.
(c) Average Home Lending loans held-for sale and loans at fair value were $8.1 billion, $10.8 billion, $17.8 billion, $17.1 billion and $14.2 billion for the three months ended June 30, 2022, March 31, 2022, December 31, 2021, September 30, 2021 and June 30, 2021, respectively,
and $9.5 billion and $13.3 billion for the six months ended June 30, 2022 and 2021, respectively.
Page 12View entire presentation