Apollo Global Management Mergers and Acquisitions Presentation Deck slide image

Apollo Global Management Mergers and Acquisitions Presentation Deck

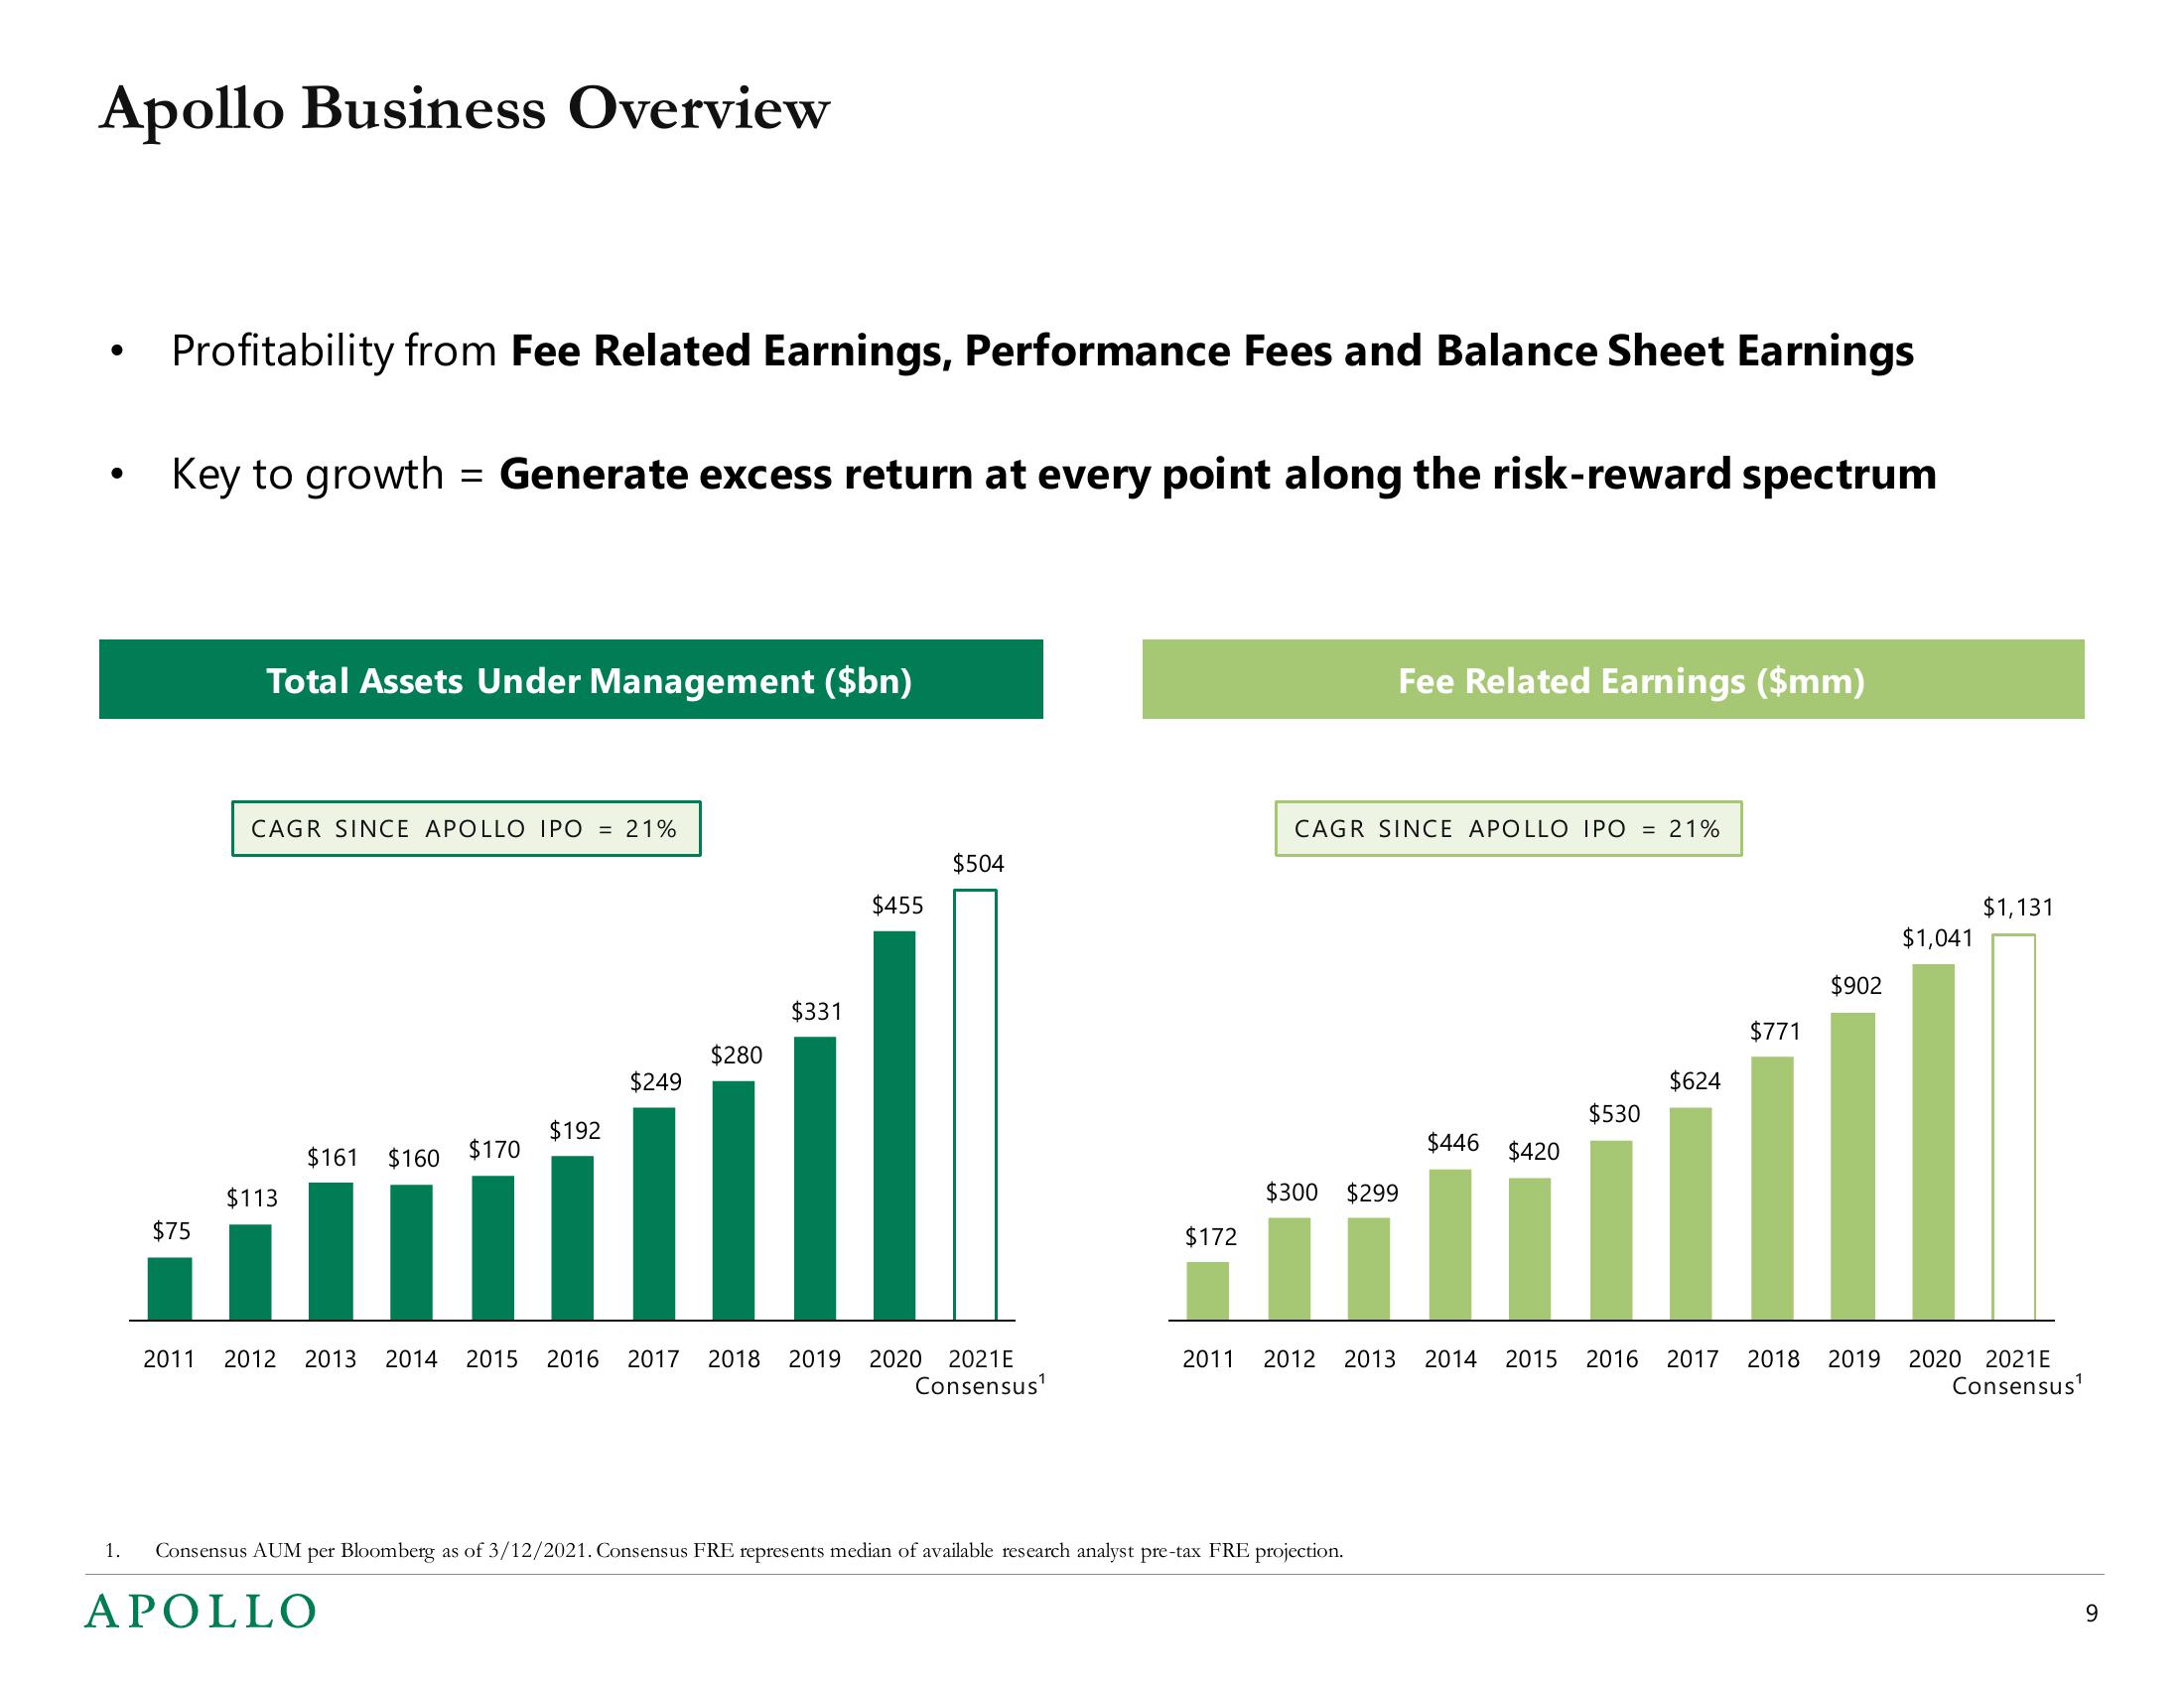
Apollo Business Overview Profitability from Fee Related Earnings, Performance Fees and Balance Sheet Earnings Key to growth = Generate excess return at every point along the risk-reward spectrum 1. $75 Total Assets Under Management ($bn) CAGR SINCE APOLLO IPO = 21% $113 $161 $160 $170 $192 $249 $280 $331 $455 $504 2011 2012 2013 2014 2015 2016 2017 2018 2019 2020 2021E Consensus¹ $172 2011 CAGR SINCE APOLLO IPO = 21% $300 $299 Fee Related Earnings ($mm) Consensus AUM per Bloomberg as of 3/12/2021. Consensus FRE represents median of available research analyst pre-tax FRE projection. APOLLO $446 $420 $530 $624 $771 $902 $1,041 $1,131 2012 2013 2014 2015 2016 2017 2018 2019 2020 2021E Consensus¹ 9
View entire presentation