Uber Results Presentation Deck
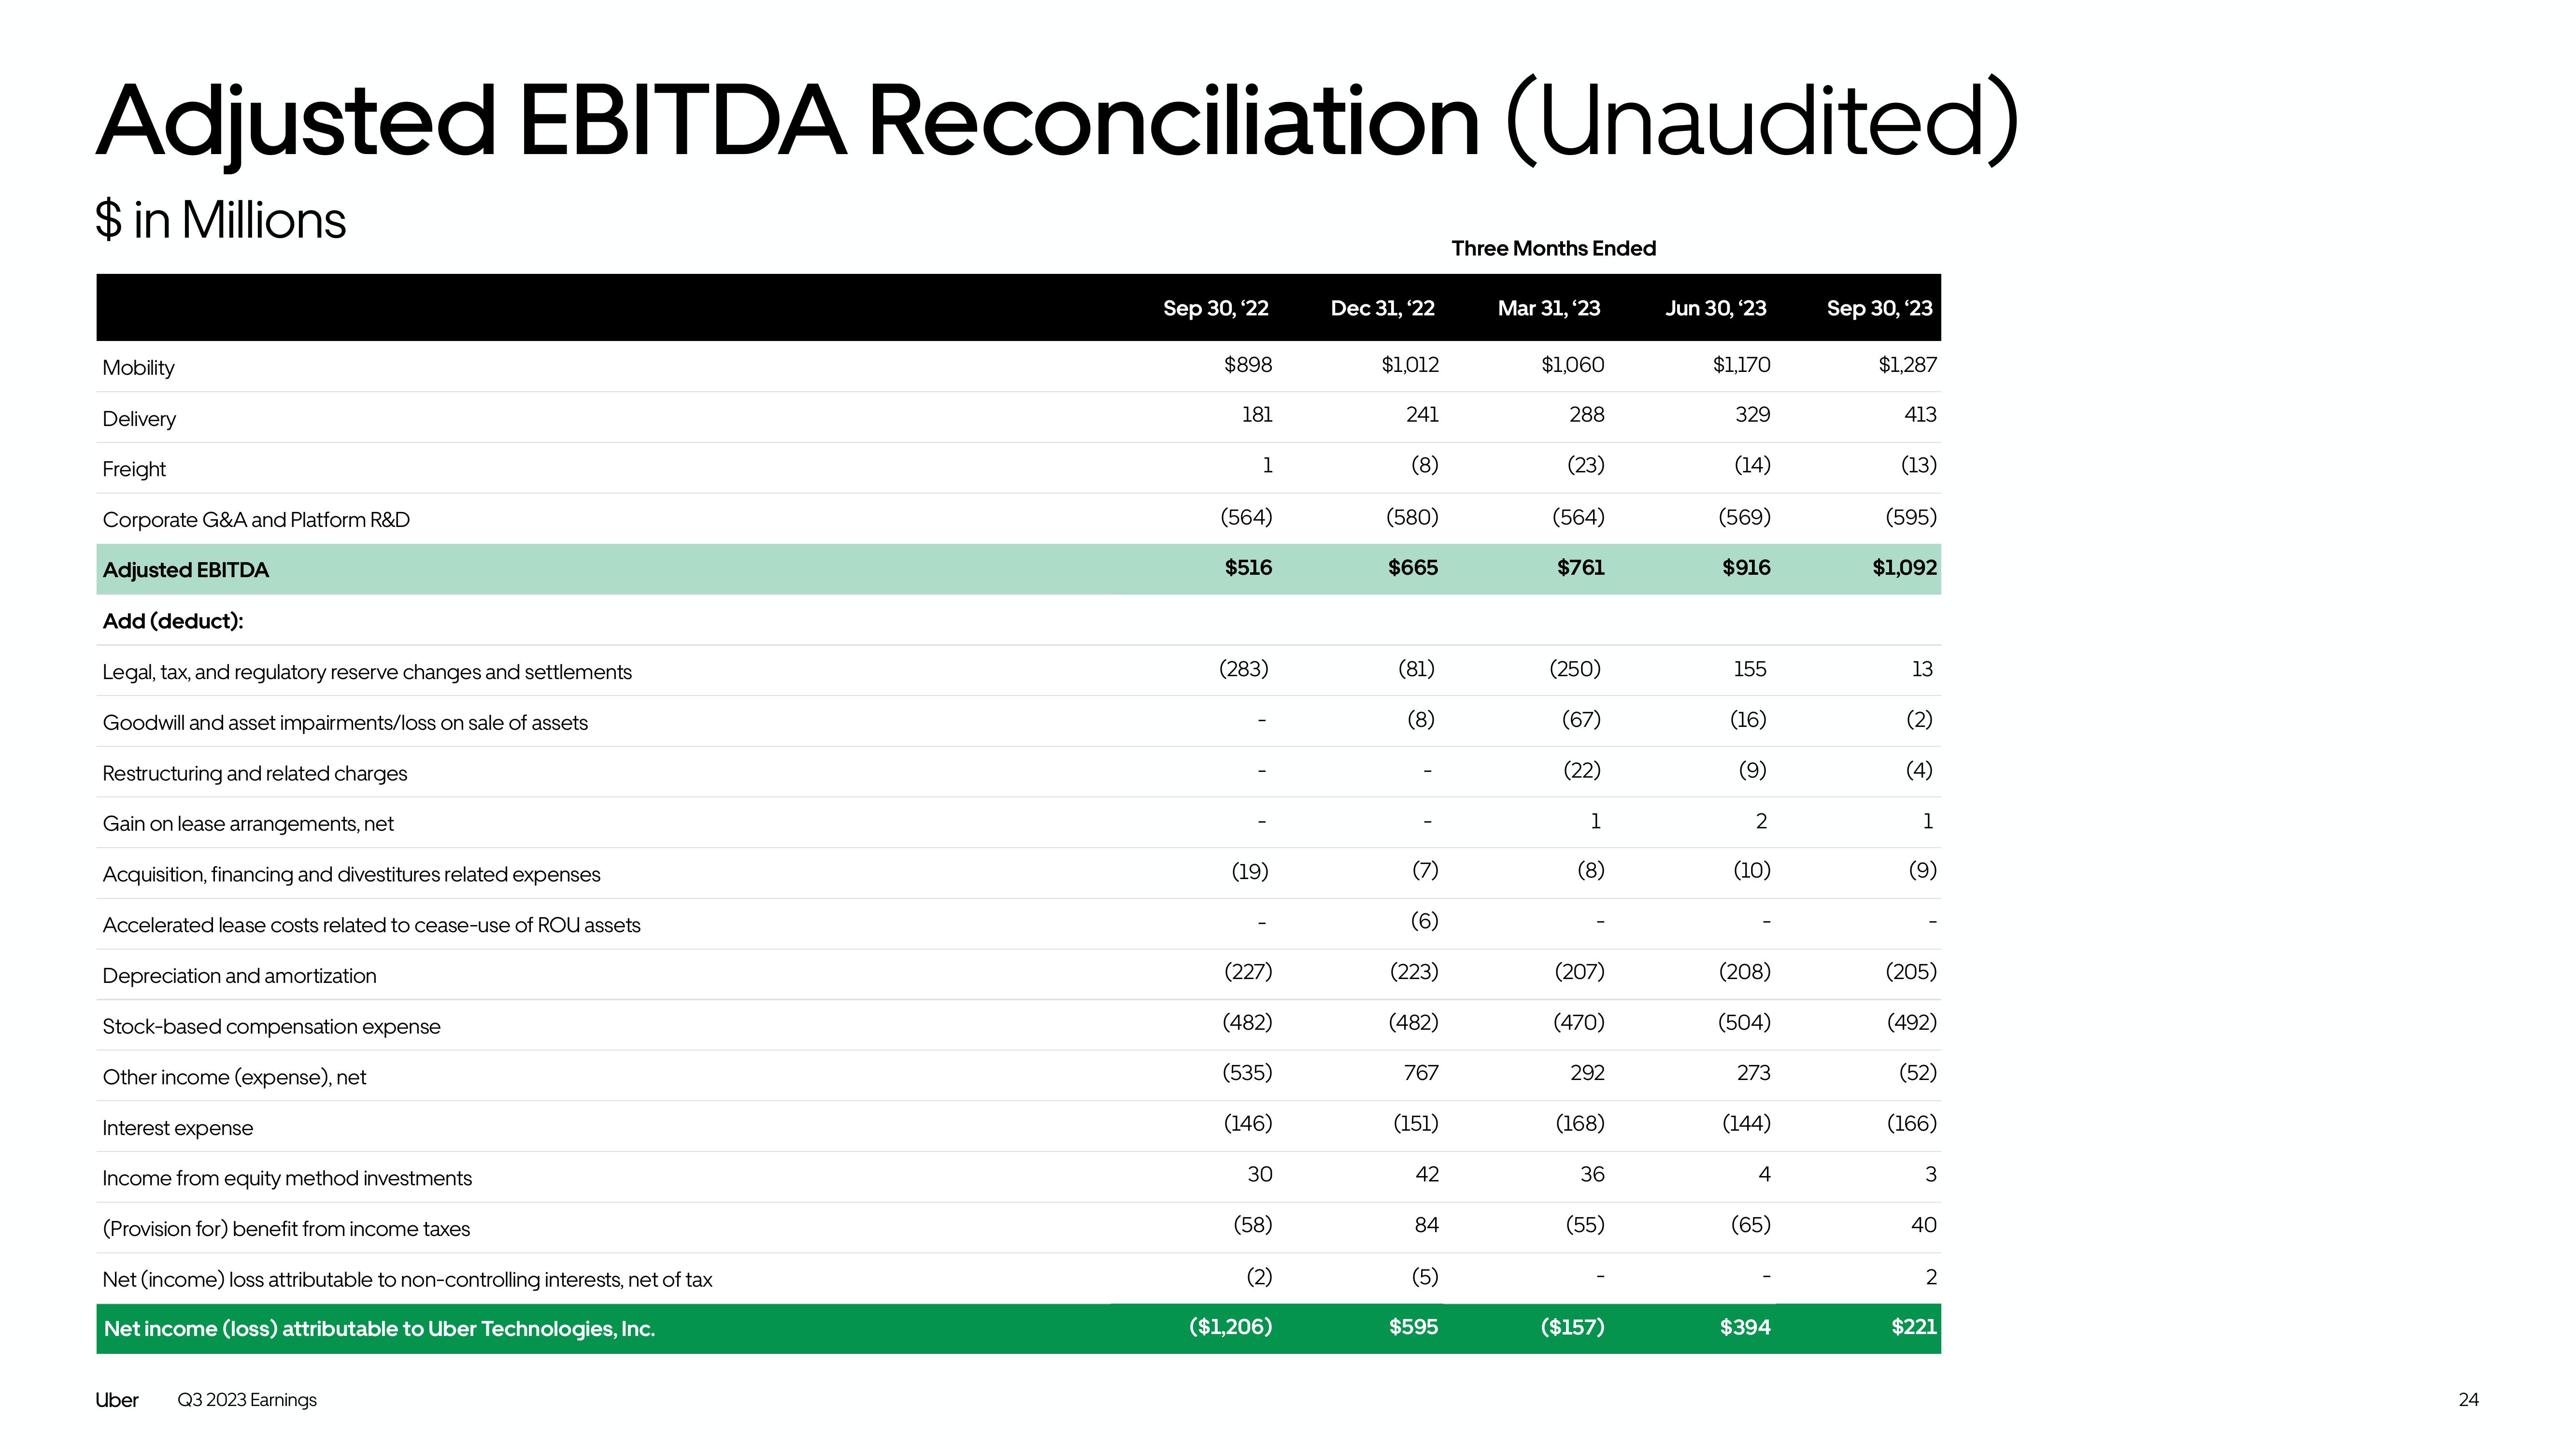
Adjusted EBITDA Reconciliation (Unaudited)
$ in Millions
Mobility
Delivery
Freight
Corporate G&A and Platform R&D
Adjusted EBITDA
Add (deduct):
Legal, tax, and regulatory reserve changes and settlements
Goodwill and asset impairments/loss on sale of assets
Restructuring and related charges
Gain on lease arrangements, net
Acquisition, financing and divestitures related expenses
Accelerated lease costs related to cease-use of ROU assets
Depreciation and amortization
Stock-based compensation expense
Other income (expense), net
Interest expense
Income from equity method investments
(Provision for) benefit from income taxes
Net (income) loss attributable to non-controlling interests, net of tax
Net income (loss) attributable to Uber Technologies, Inc.
Uber
Q3 2023 Earnings
Sep 30, '22
$898
181
1
(564)
$516
(283)
(19)
(227)
(482)
(535)
(146)
30
(58)
(2)
($1,206)
Dec 31, '22
$1,012
241
(8)
(580)
$665
(81)
(8)
(7)
(6)
(223)
(482)
767
(151)
42
84
(5)
$595
Three Months Ended
Mar 31, '23
$1,060
288
(23)
(564)
$761
(250)
(67)
(22)
1
(8)
(207)
(470)
292
(168)
36
(55)
($157)
Jun 30, '23
$1,170
329
(14)
(569)
$916
155
(16)
(9)
2
(10)
(208)
(504)
273
(144)
4
(65)
$394
Sep 30, ¹23
$1,287
413
(13)
(595)
$1,092
13
(2)
(4)
1
(9)
(205)
(492)
(52)
(166)
3
40
2
$221
24View entire presentation