Cyxtera SPAC Presentation Deck
Attractive Financial Profile
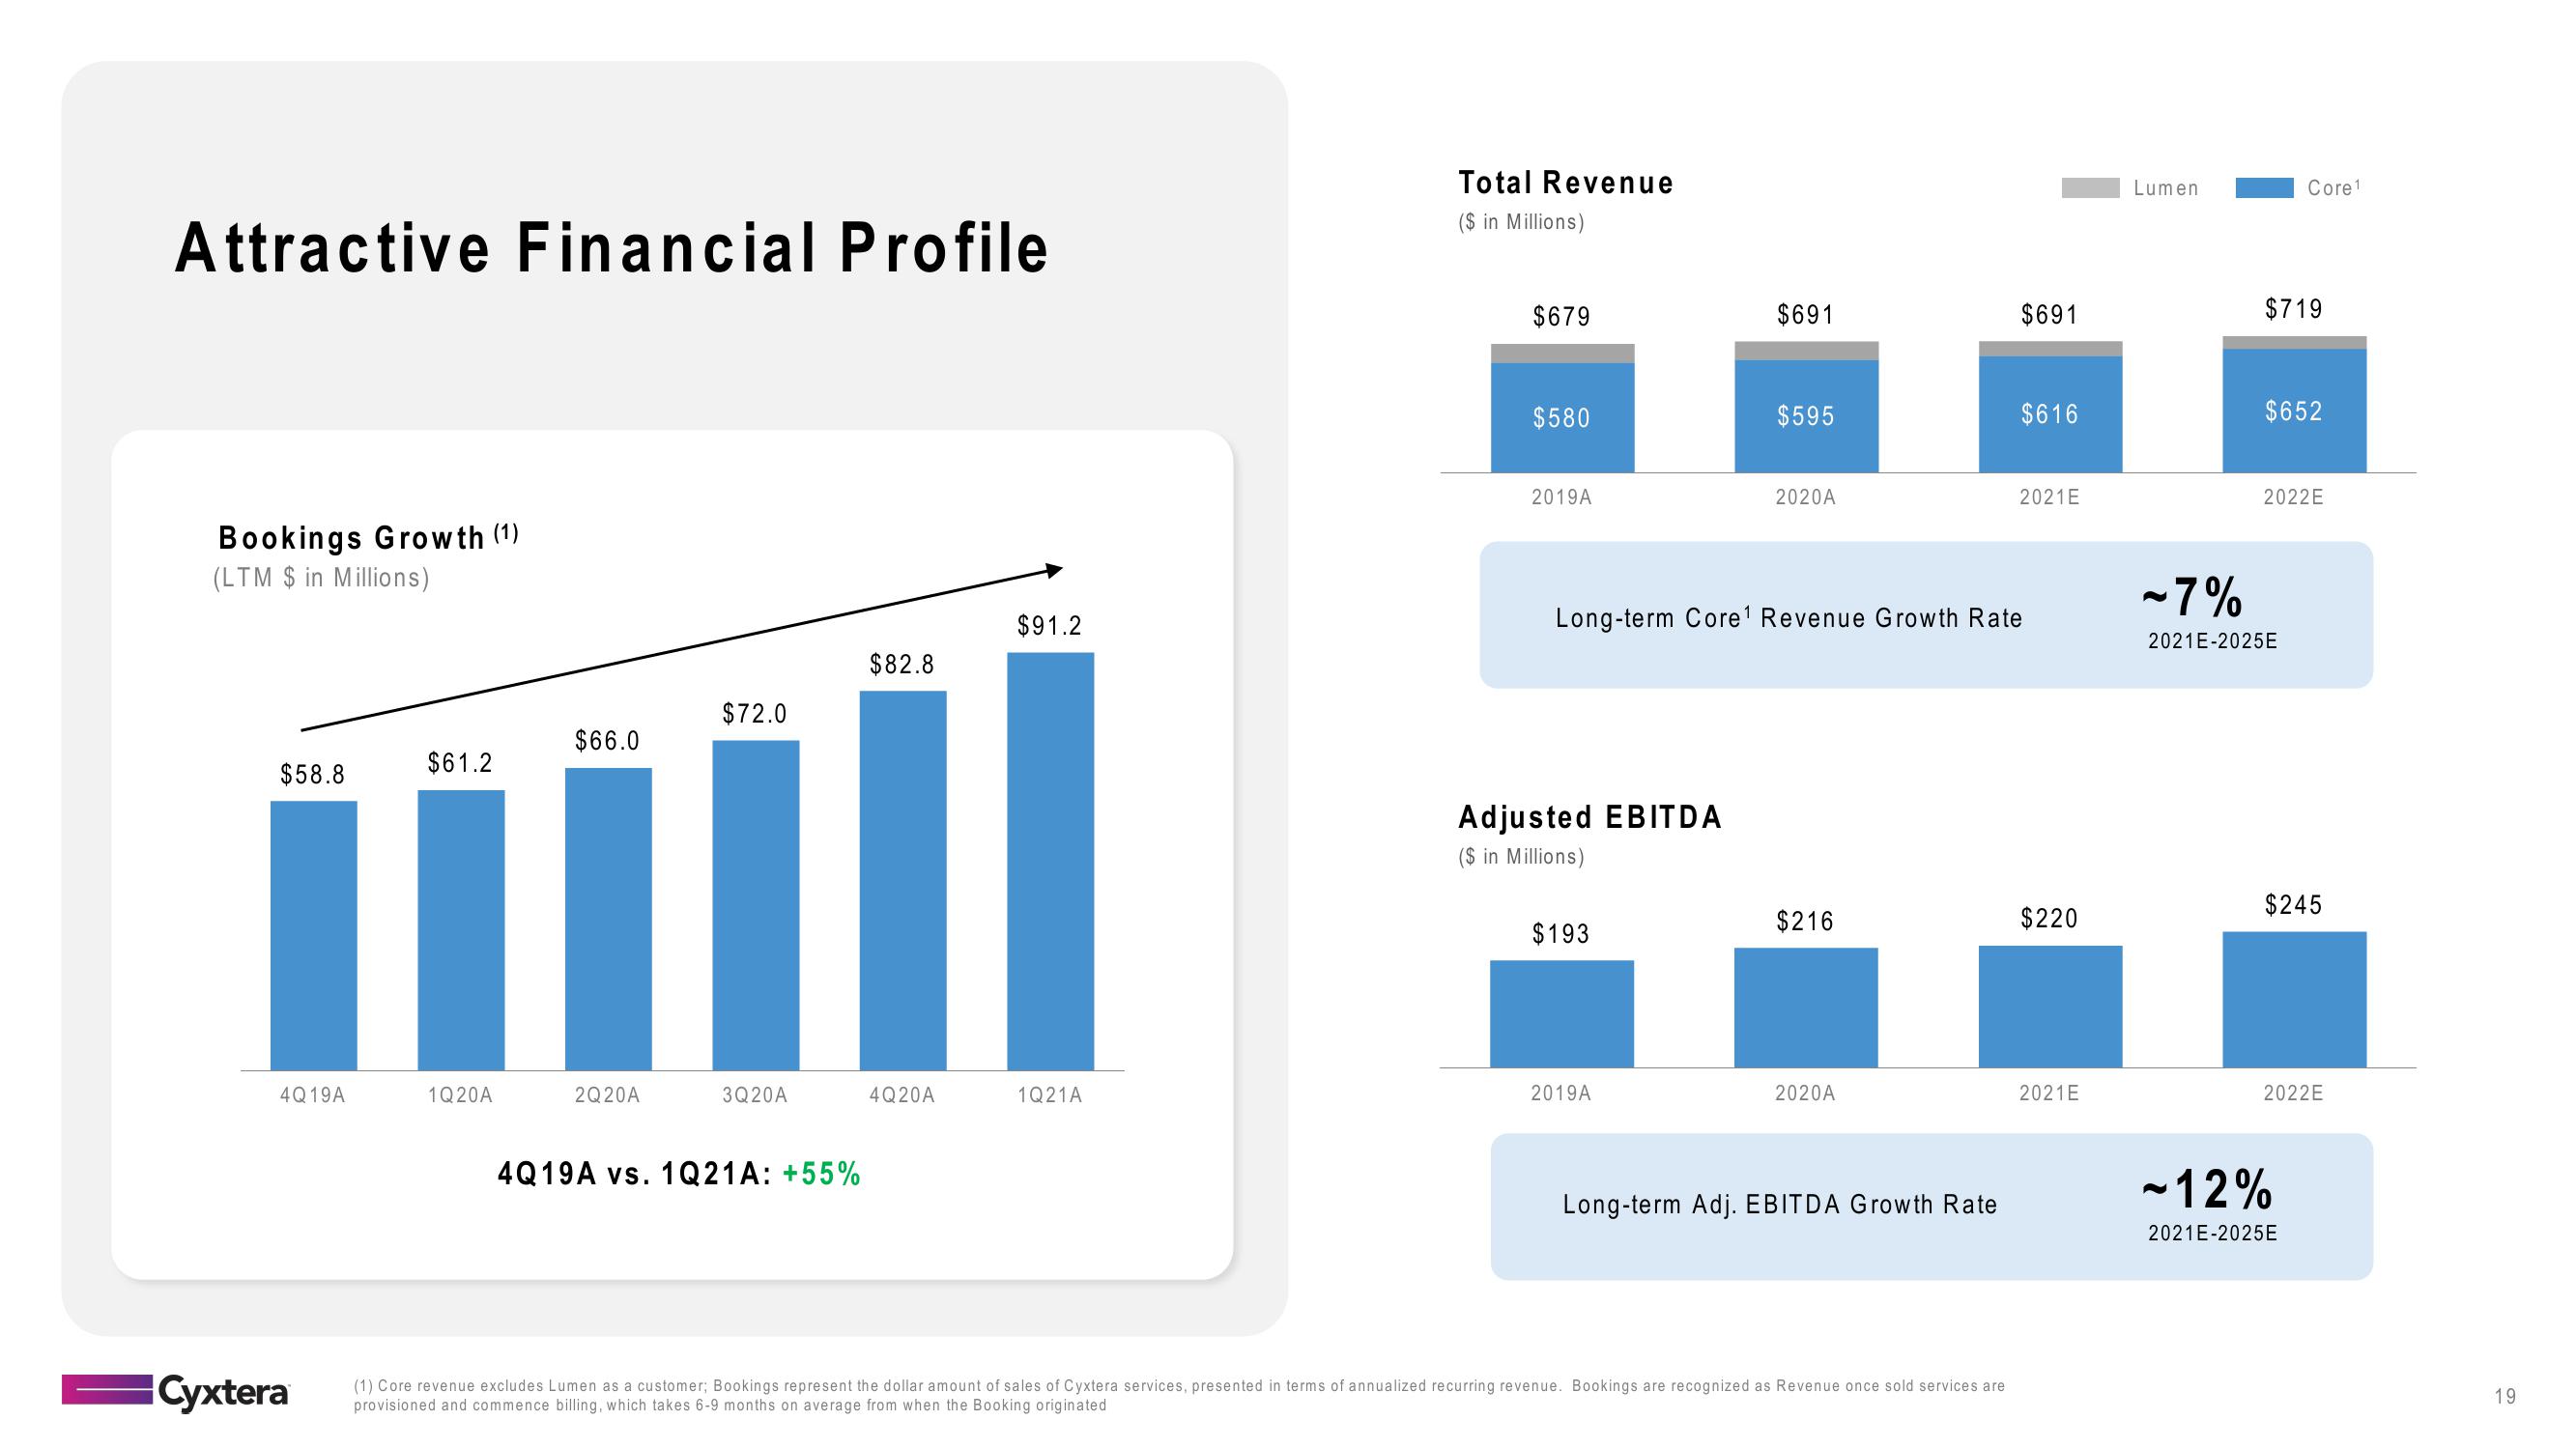
Bookings Growth (1)
(LTM $ in Millions)
$58.8
4Q19A
Cyxtera
$61.2
1Q20A
$66.0
2Q20A
$72.0
3Q20A
4Q19A vs. 1Q21A: +55%
$82.8
4Q20A
$91.2
1Q21A
Total Revenue
($ in Millions)
$679
$580
2019A
Adjusted EBITDA
($ in Millions)
$193
$691
2019A
$595
2020A
Long-term Core¹ Revenue Growth Rate
$216
2020A
Long-term Adj. EBITDA Growth Rate
$691
(1) Core revenue excludes Lumen as a customer; Bookings represent the dollar amount of sales of Cyxtera services, presented in terms of annualized recurring revenue. Bookings are recognized as Revenue once sold services are
provisioned and commence billing, which takes 6-9 months on average from when the Booking originated
$616
2021E
$220
2021E
Lumen
$719
Core1
$652
2022E
-7%
2021E-2025E
$245
2022E
-12%
2021E-2025E
19View entire presentation