Apollo Global Management Investor Presentation Deck
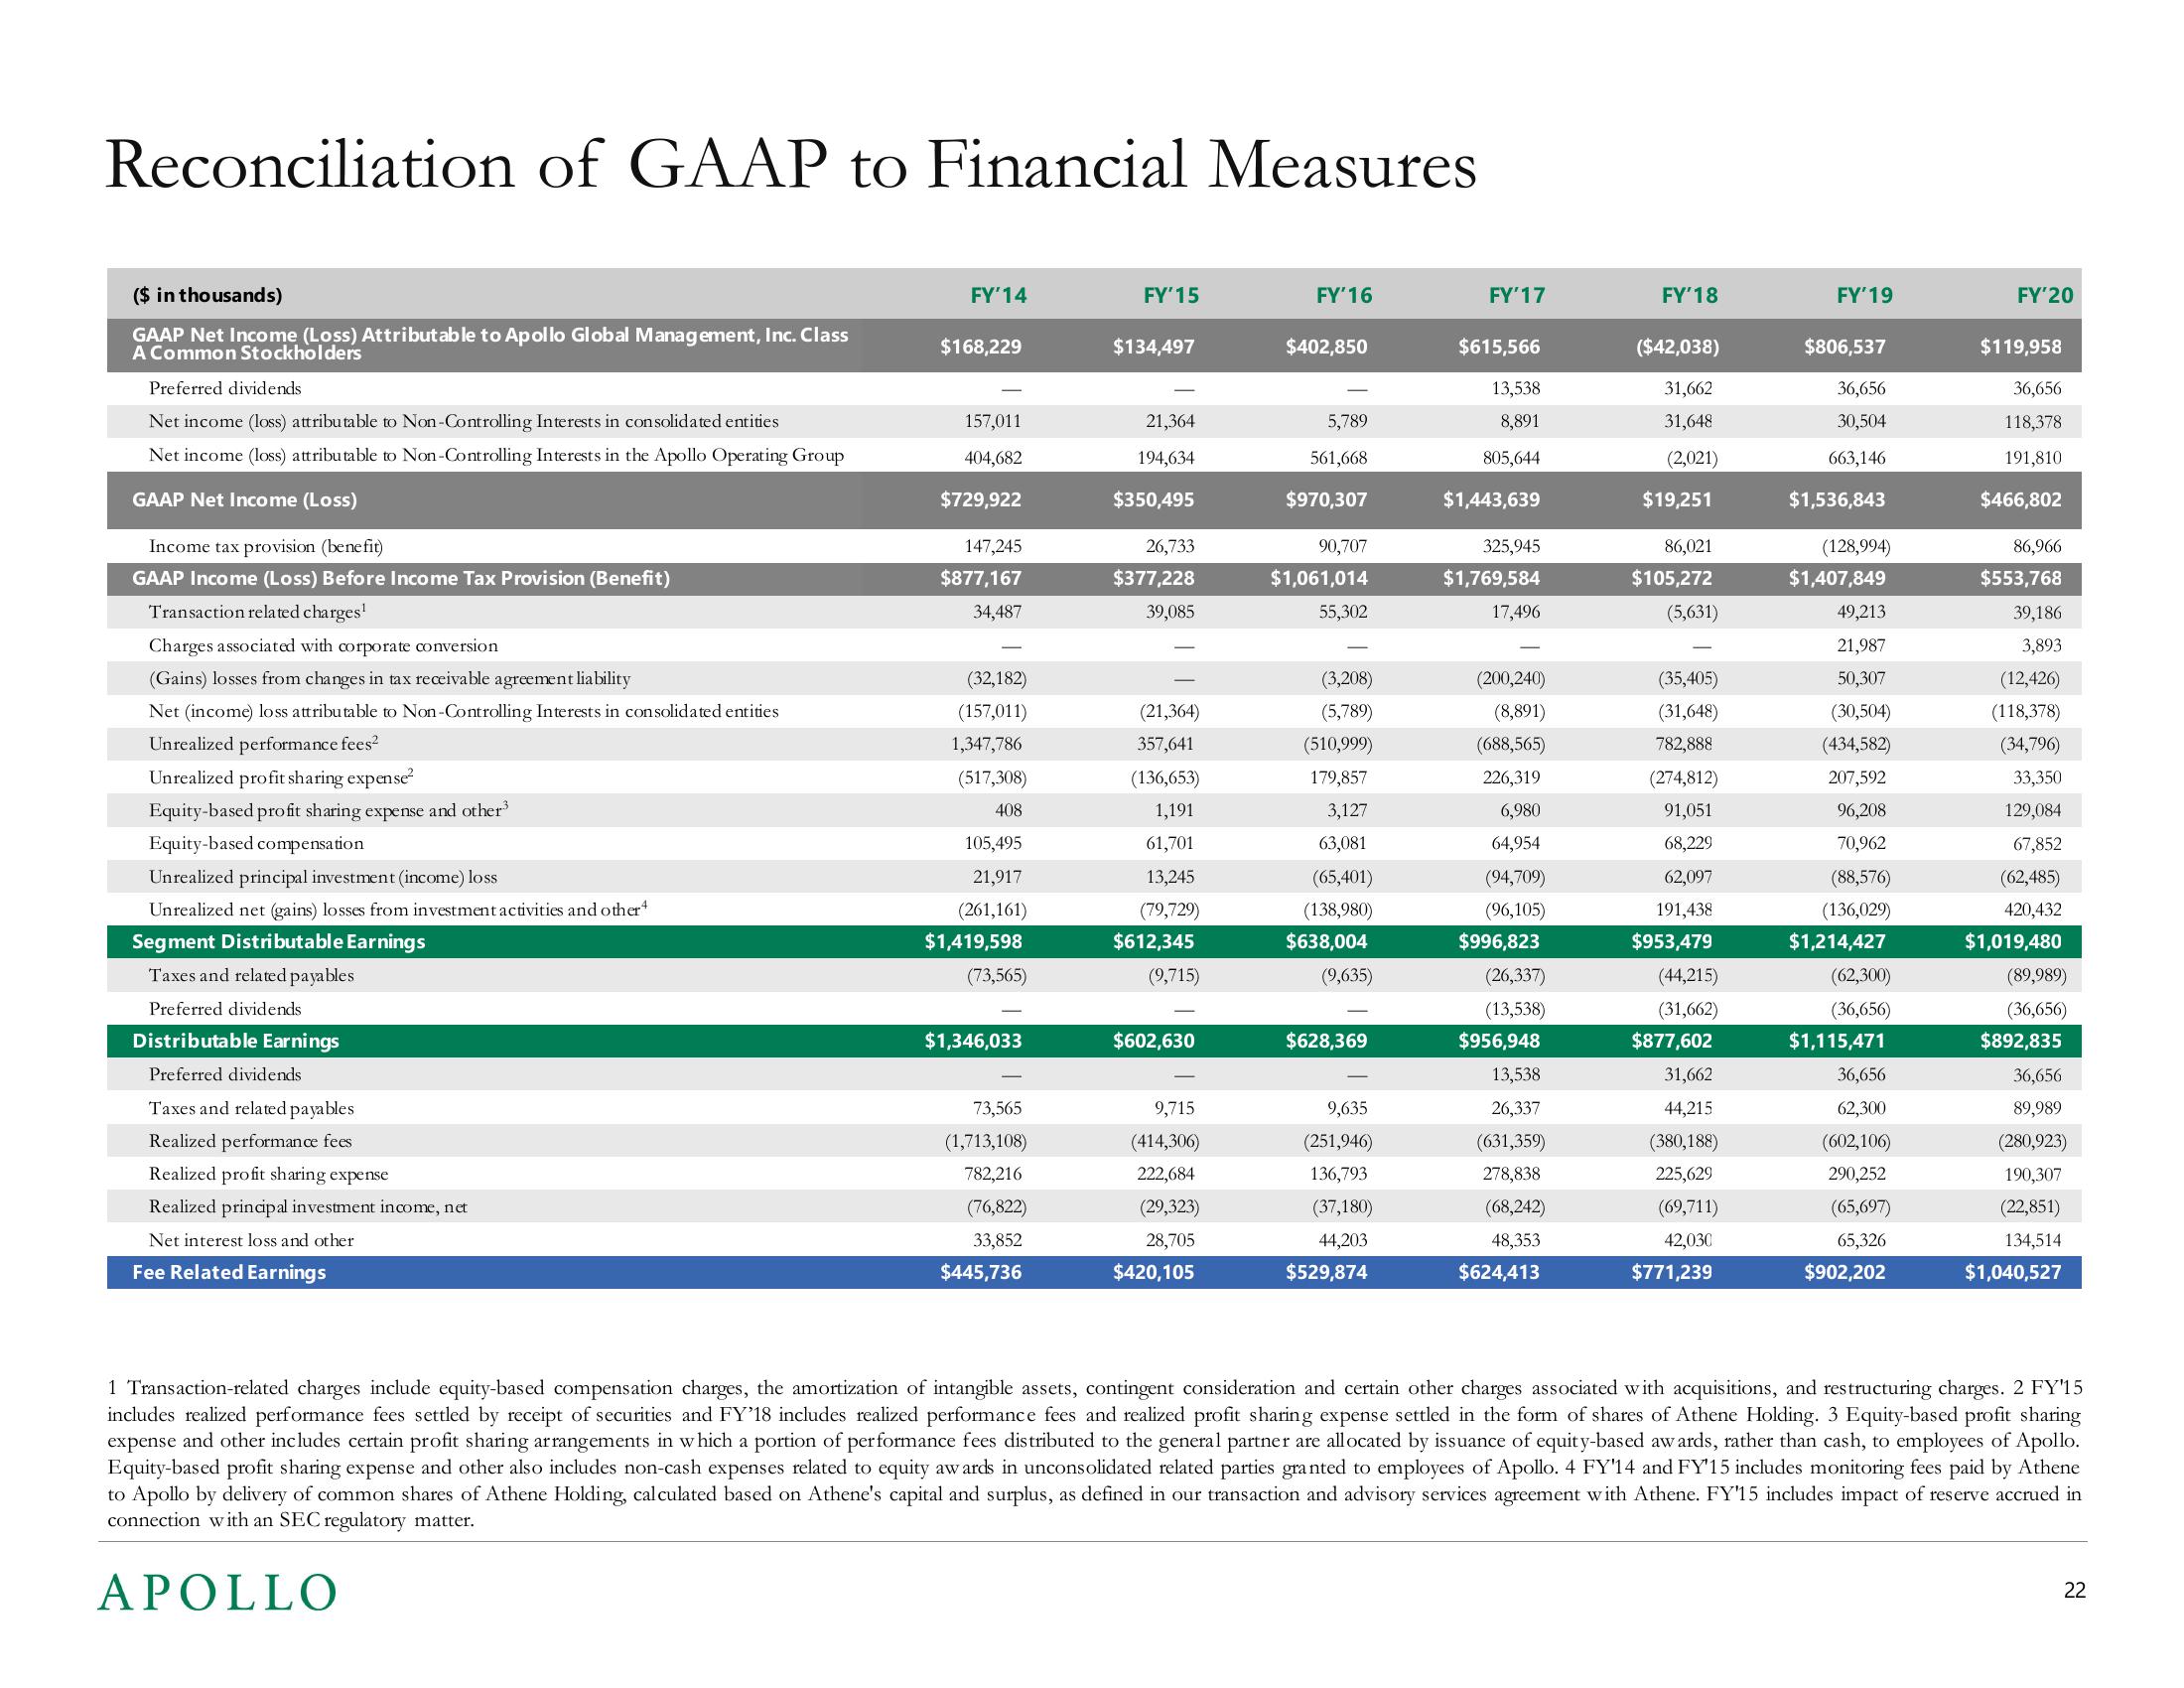
Reconciliation of GAAP to Financial Measures
($ in thousands)
GAAP Net Income (Loss) Attributable to Apollo Global Management, Inc. Class
A Common Stockholders
Preferred dividends
Net income (loss) attributable to Non-Controlling Interests in consolidated entities
Net income (loss) attributable to Non-Controlling Interests in the Apollo Operating Group
GAAP Net Income (Loss)
Income tax provision (benefit)
GAAP Income (Loss) Before Income Tax Provision (Benefit)
Transaction related charges¹
Charges associated with corporate conversion
(Gains) losses from changes in tax receivable agreement liability
Net (income) loss attributable to Non-Controlling Interests in consolidated entities
Unrealized performance fees²
Unrealized profit sharing expense²
Equity-based profit sharing expense and other³
Equity-based compensation
Unrealized principal investment (income) loss
Unrealized net (gains) losses from investment activities and other
Segment Distributable Earnings
Taxes and related payables
Preferred dividends
Distributable Earnings
Preferred dividends
Taxes and related payables
Realized performance fees
Realized profit sharing expense
Realized principal investment income, net
Net interest loss and other
Fee Related Earnings
FY'14
$168,229
157,011
$729,922
147,245
$877,167
34,487
(32,182)
(157,011)
1,347,786
(517,308)
408
105,495
21,917
(261,161)
$1,419,598
(73,565)
$1,346,033
73,565
(1,713,108)
782,216
(76,822)
33,852
$445,736
FY'15
$134,497
21,364
94,634
$350,495
26,733
$377,228
39,085
(21,364)
357,641
(136,653)
1,191
61,701
13,245
(79,729)
$612,345
(9,715)
$602,630
9,715
(414,306)
222,684
(29,323)
28,705
$420,105
FY'16
$402,850
5,789
561,668
$970,307
90,707
$1,061,014
55,302
(3,208)
(5,789)
(510,999)
179,857
3,127
63,081
(65,401)
(138,980)
$638,004
(9,635)
$628,369
9,635
(251,946)
136,793
(37,180)
44,203
$529,874
FY'17
$615,566
13,538
8,891
805,644
$1,443,639
325,945
$1,769,584
17,496
(200,240)
(8,891)
(688,565)
226,319
6,980
64,954
(94,709)
(96,105)
$996,823
(26,337)
(13,538)
$956,948
13,538
26,337
(631,359)
278,838
(68,242)
48,353
$624,413
FY'18
($42,038)
31,662
31,648
(2,021)
$19,251
86,021
$105,272
(5,631)
(35,405)
(31,648)
782,888
(274,812)
91,051
68,229
62,097
191,438
$953,479
(44,215)
(31,662)
$877,602
31,662
44,215
(380,188)
225,629
(69,711)
42,030
$771,239
FY'19
$806,537
36,656
30,504
663,146
$1,536,843
(128,994)
$1,407,849
49,213
21,987
50,307
(30,504)
(434,582)
207,592
96,208
70,962
(88,576)
(136,029)
$1,214,427
(62,300)
(36,656)
$1,115,471
36,656
62,300
(602,106)
290,252
(65,697)
65,326
$902,202
FY'20
$119,958
36,656
118,378
191,810
$466,802
86,966
$553,768
39,186
3,893
(12,426)
(118,378)
(34,796)
33,350
129,084
67,852
(62,485)
420,432
$1,019,480
(89,989)
(36,656)
$892,835
36,656
89,989
(280,923)
190,307
(22,851)
134,514
$1,040,527
1 Transaction-related charges include equity-based compensation charges, the amortization of intangible assets, contingent consideration and certain other charges associated with acquisitions, and restructuring charges. 2 FY'15
includes realized performance fees settled by receipt of securities and FY'18 includes realized performance fees and realized profit sharing expense settled in the form of shares of Athene Holding. 3 Equity-based profit sharing
expense and other includes certain profit sharing arrangements in which a portion of performance fees distributed to the general partner are allocated by issuance of equity-based awards, rather than cash, to employees of Apollo.
Equity-based profit sharing expense and other also includes non-cash expenses related to equity awards in unconsolidated related parties granted to employees of Apollo. 4 FY'14 and FY'15 includes monitoring fees paid by Athene
to Apollo by delivery of common shares of Athene Holding, calculated based on Athene's capital and surplus, as defined in our transaction and advisory services agreement with Athene. FY'15 includes impact of reserve accrued in
connection with an SEC regulatory matter.
APOLLO
22View entire presentation