Pershing Square Activist Presentation Deck slide image

Pershing Square Activist Presentation Deck

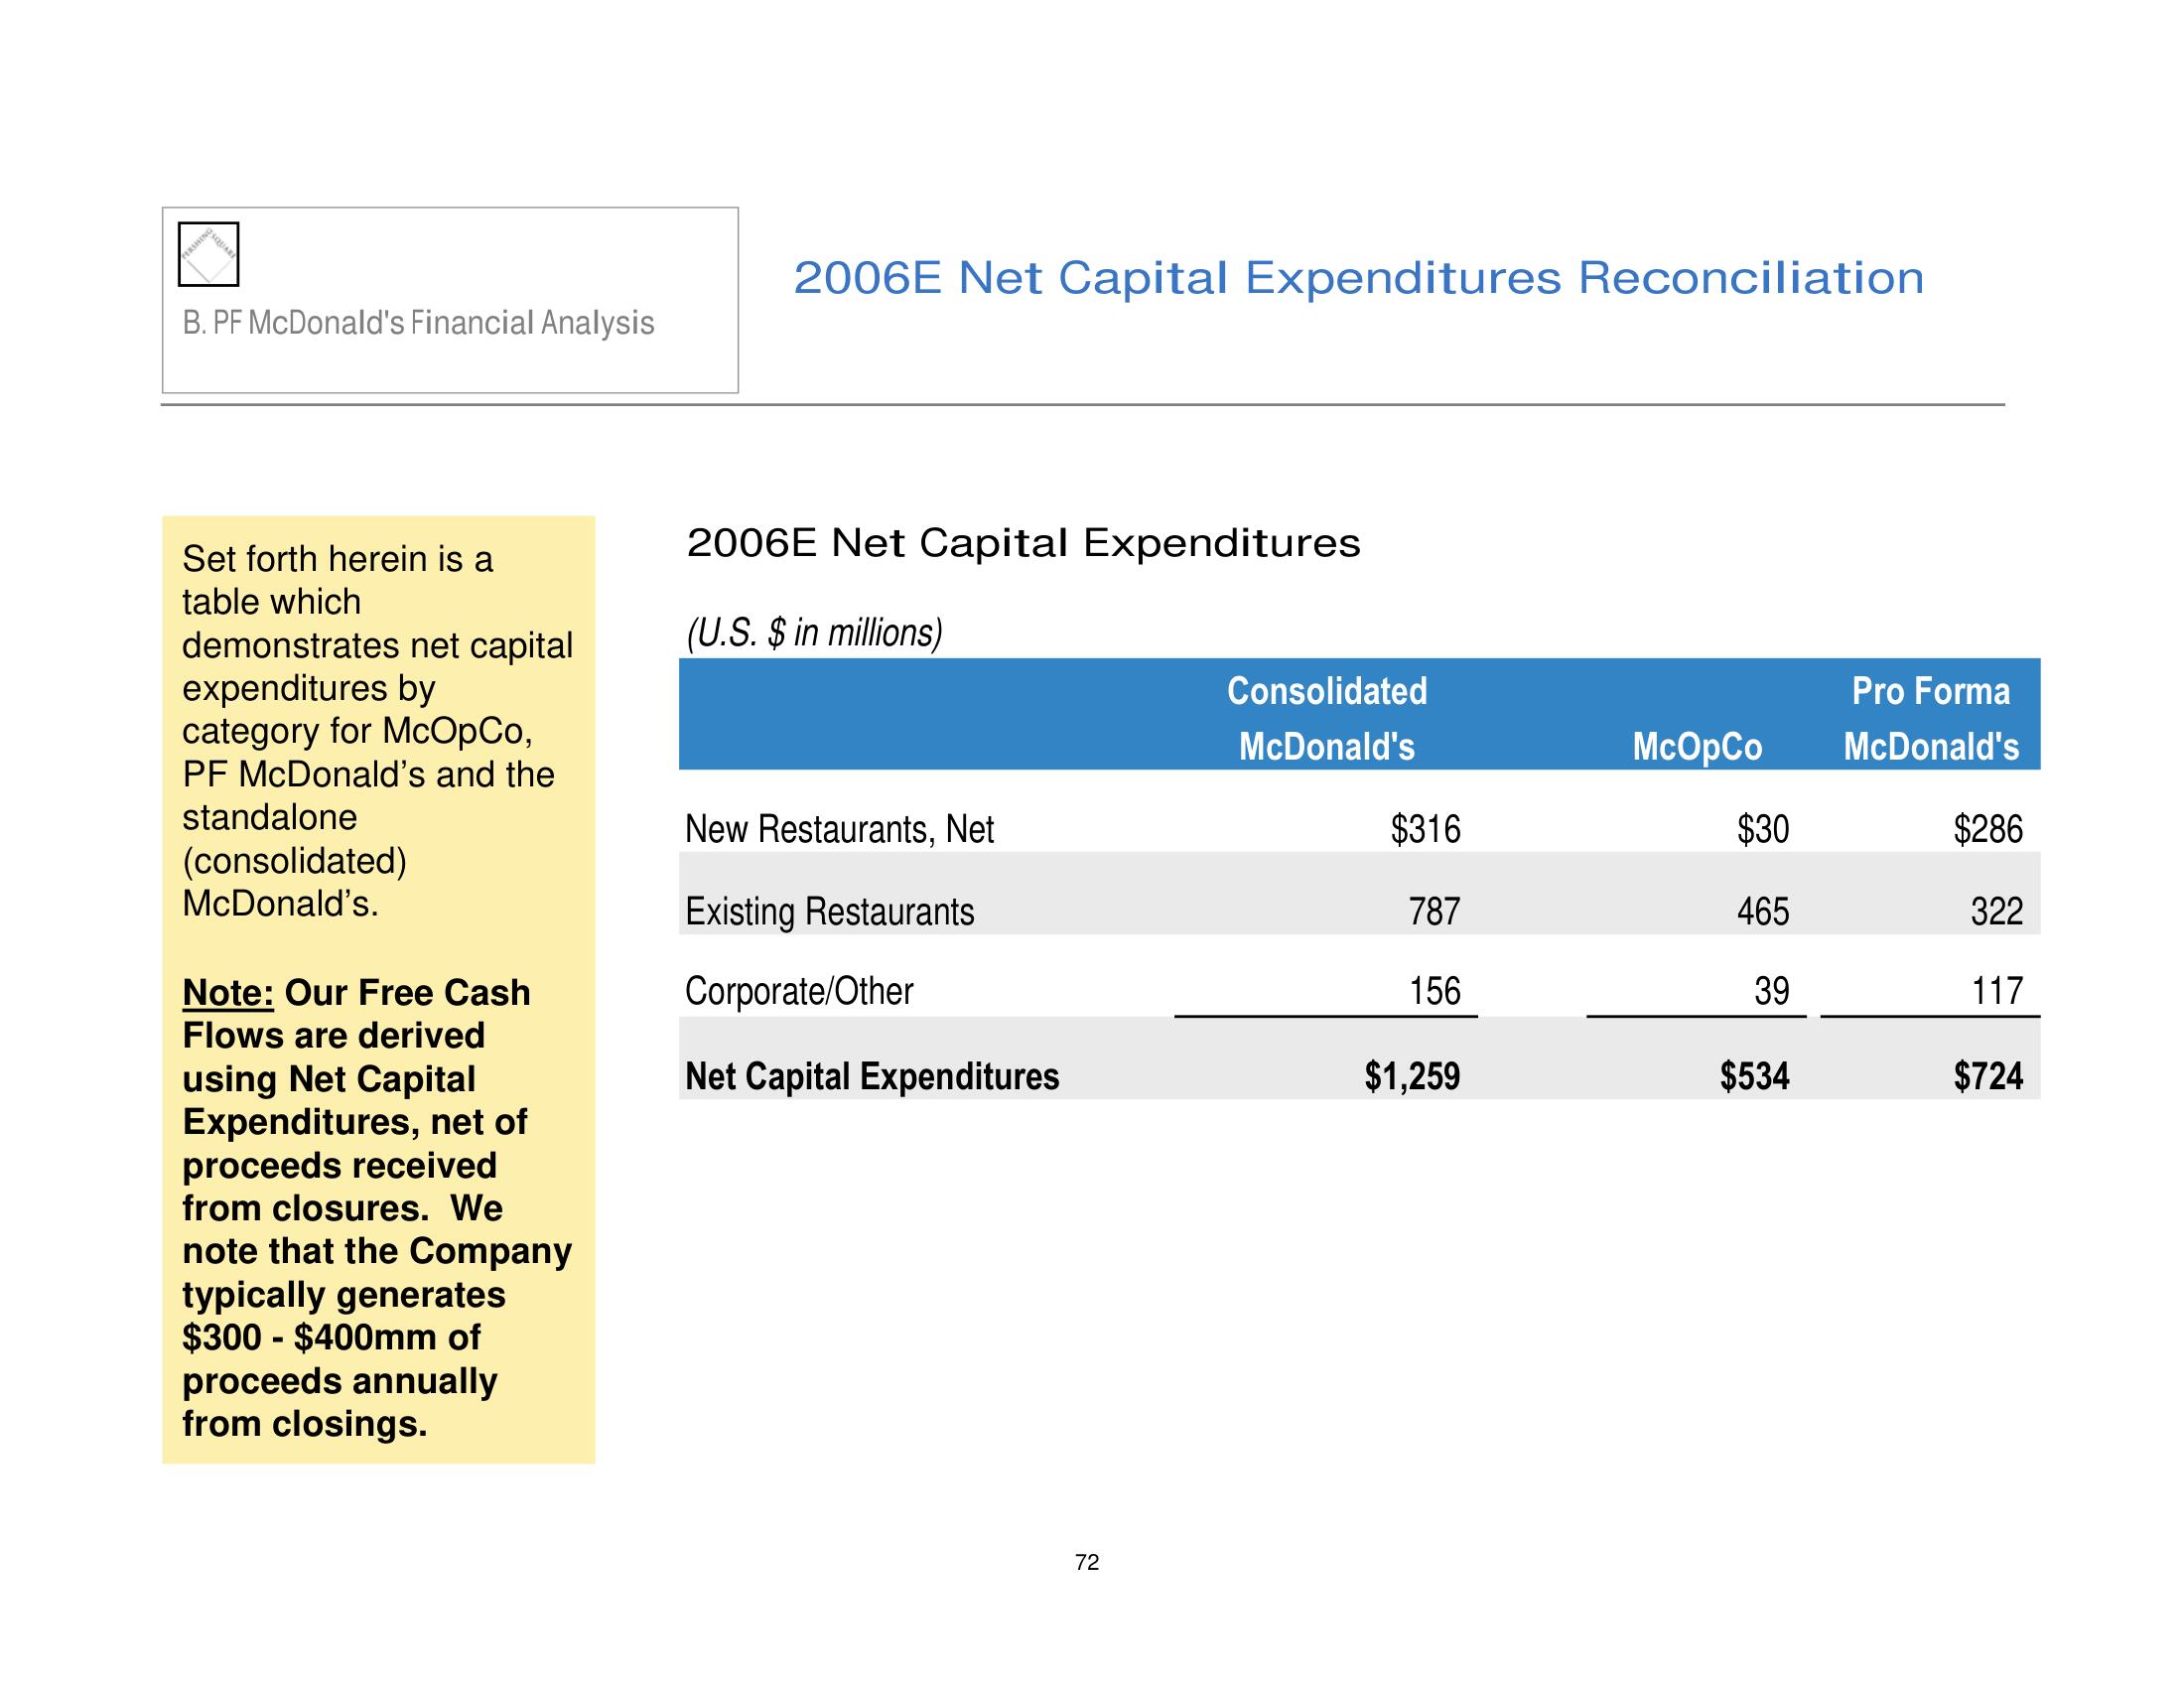
B. PF McDonald's Financial Analysis Set forth herein is a table which demonstrates net capital expenditures by category for McOpCo, PF McDonald's and the standalone (consolidated) McDonald's. Note: Our Free Cash Flows are derived using Net Capital Expenditures, net of proceeds received from closures. We note that the Company typically generates $300-$400mm of proceeds annually from closings. 2006E Net Capital Expenditures Reconciliation 2006E Net Capital Expenditures (U.S. $ in millions) New Restaurants, Net Existing Restaurants Corporate/Other Net Capital Expenditures 72 Consolidated McDonald's $316 787 156 $1,259 McOpCo $30 465 39 $534 Pro Forma McDonald's $286 322 117 $724
View entire presentation