Oatly Results Presentation Deck
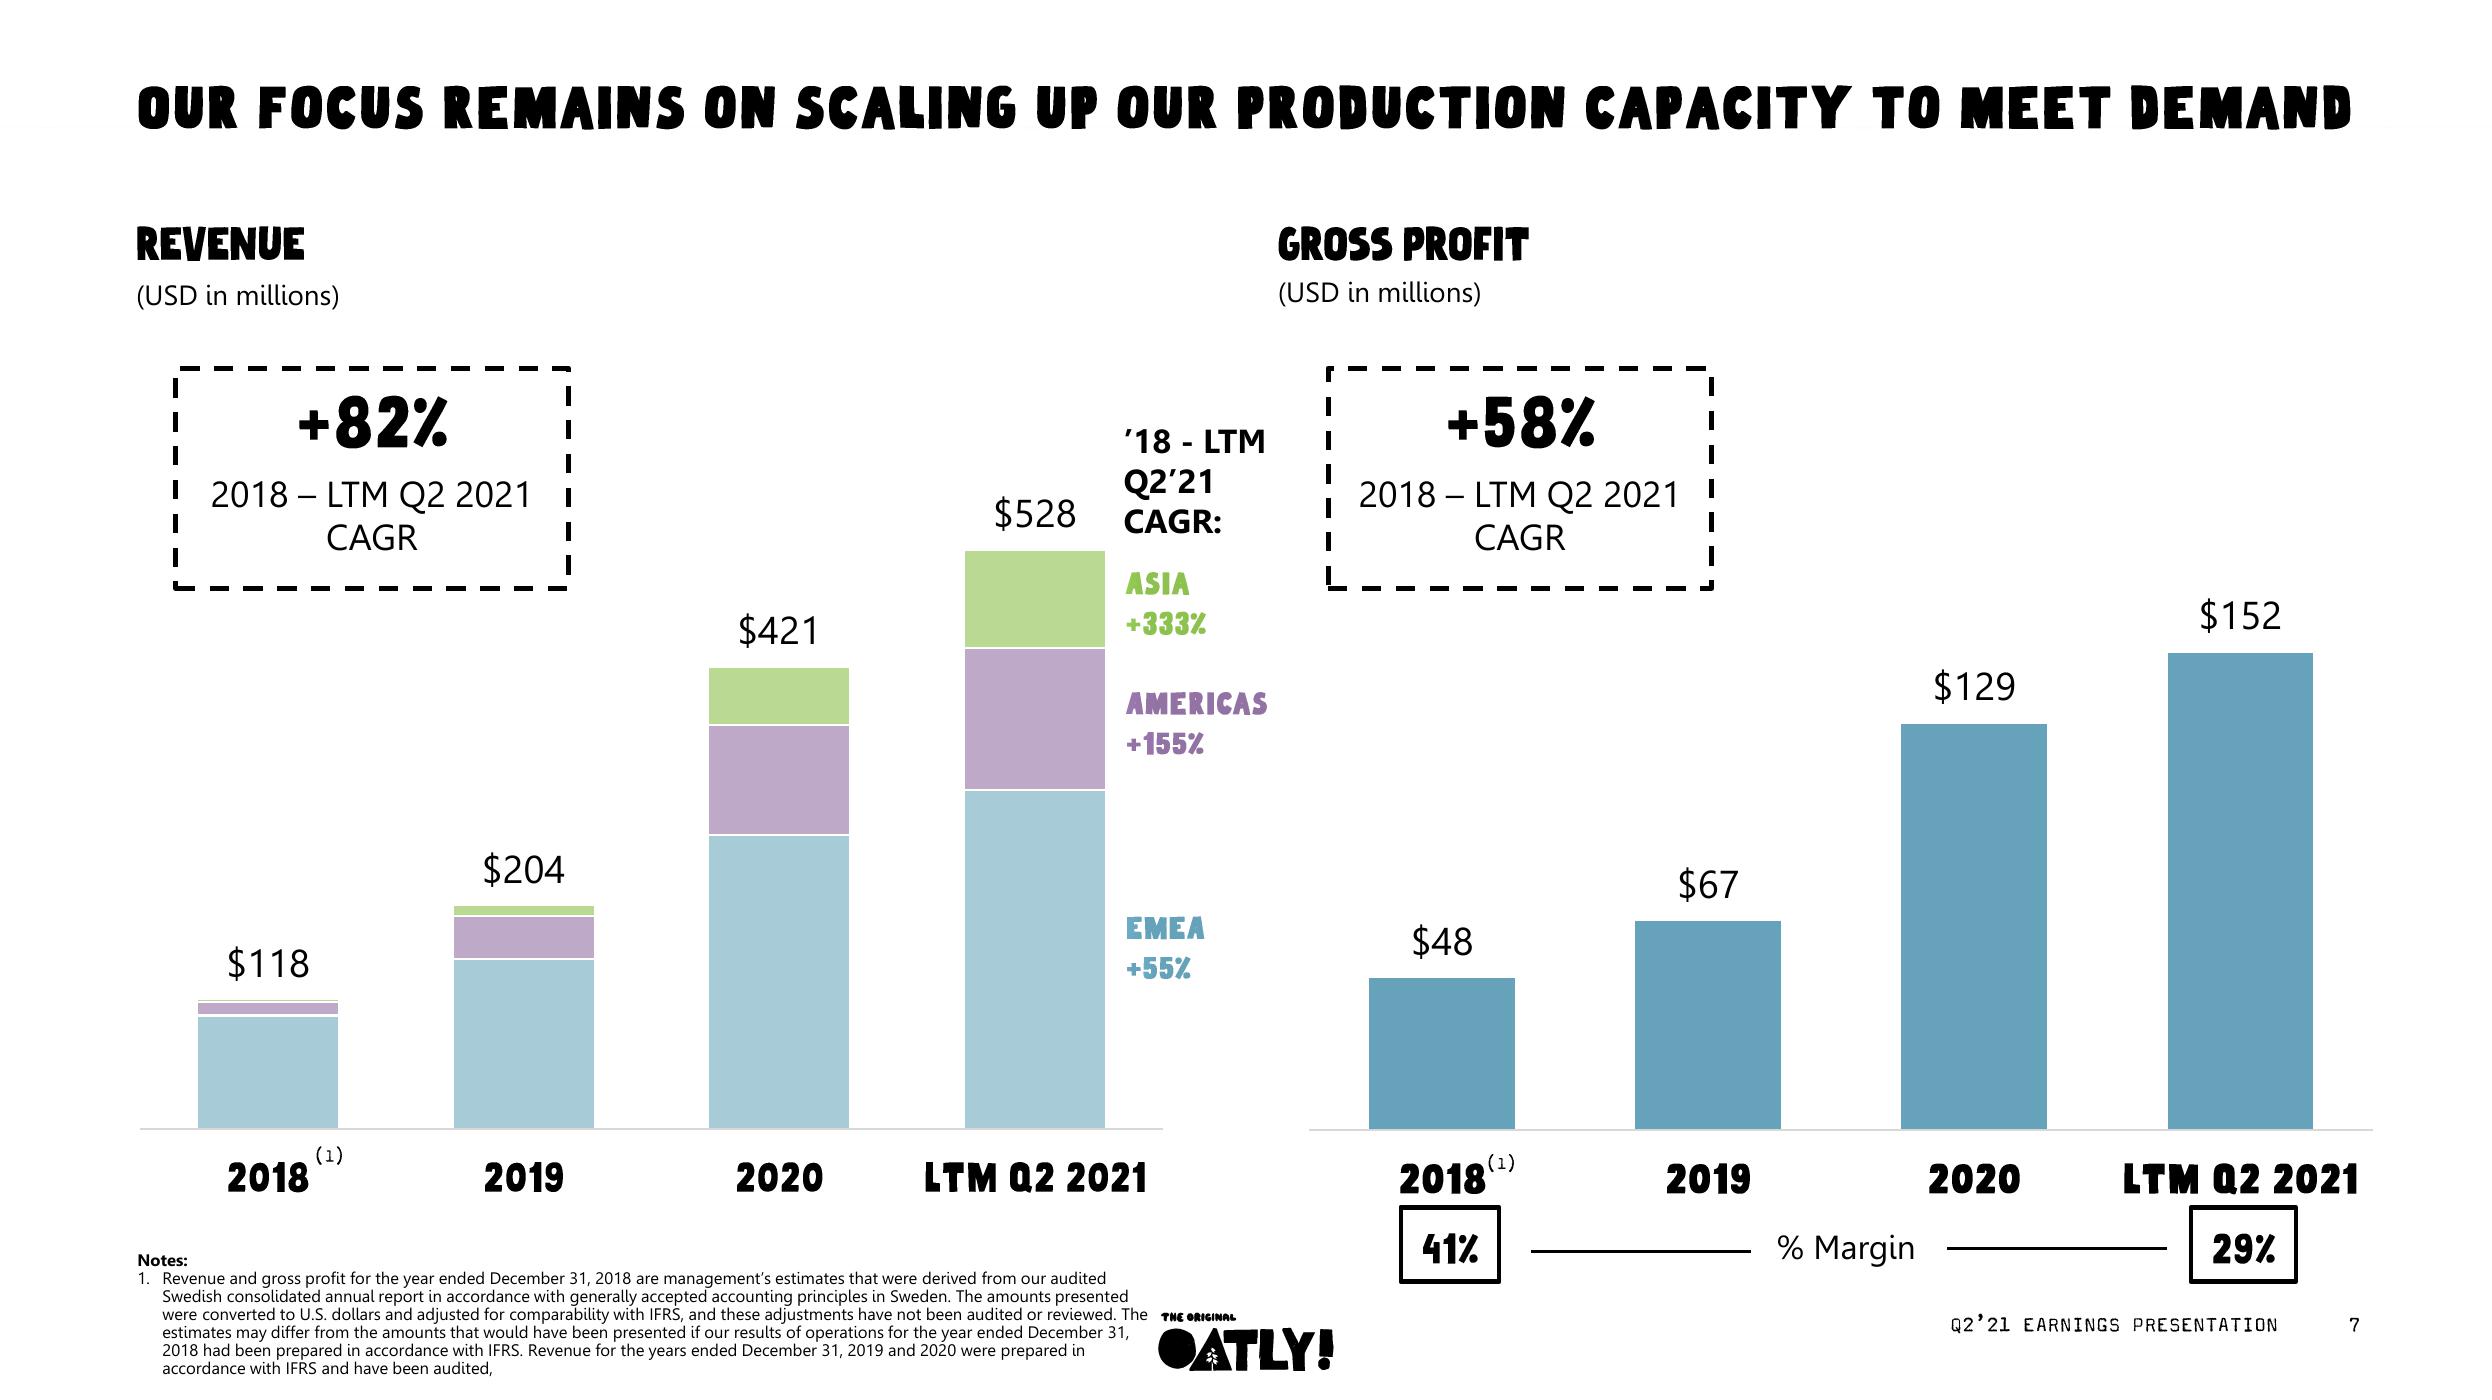
OUR FOCUS REMAINS ON SCALING UP OUR PRODUCTION CAPACITY TO MEET DEMAND
REVENUE
(USD in millions)
+82%
2018-LTM Q2 2021
CAGR
$118
2018
(1)
1
$204
2019
$421
2020
$528
'18 - LTM
Q2'21
CAGR:
ASIA
+333%
AMERICAS
+155%
EMEA
+55%
LTM Q2 2021
GROSS PROFIT
(USD in millions)
r
1
Notes:
1. Revenue and gross profit for the year ended December 31, 2018 are management's estimates that were derived from our audited
Swedish consolidated annual report in accordance with generally accepted accounting principles in Sweden. The amounts presented
were converted to U.S. dollars and adjusted for comparability with IFRS, and these adjustments have not been audited or reviewed. The THE ORIGINAL
estimates may differ from the amounts that would have been presented if our results of operations for the year ended December 31,
2018 had been prepared in accordance with IFRS. Revenue for the years ended December 31, 2019 and 2020 were prepared in
accordance with IFRS and have been audited,
OATLY!
+58%
2018-LTM Q2 2021
CAGR
$48
2018
41%
(1)
$67
2019
% Margin
$129
2020
$152
LTM Q2 2021
29%
Q2'21 EARNINGS PRESENTATION
7View entire presentation