Dave SPAC Presentation Deck
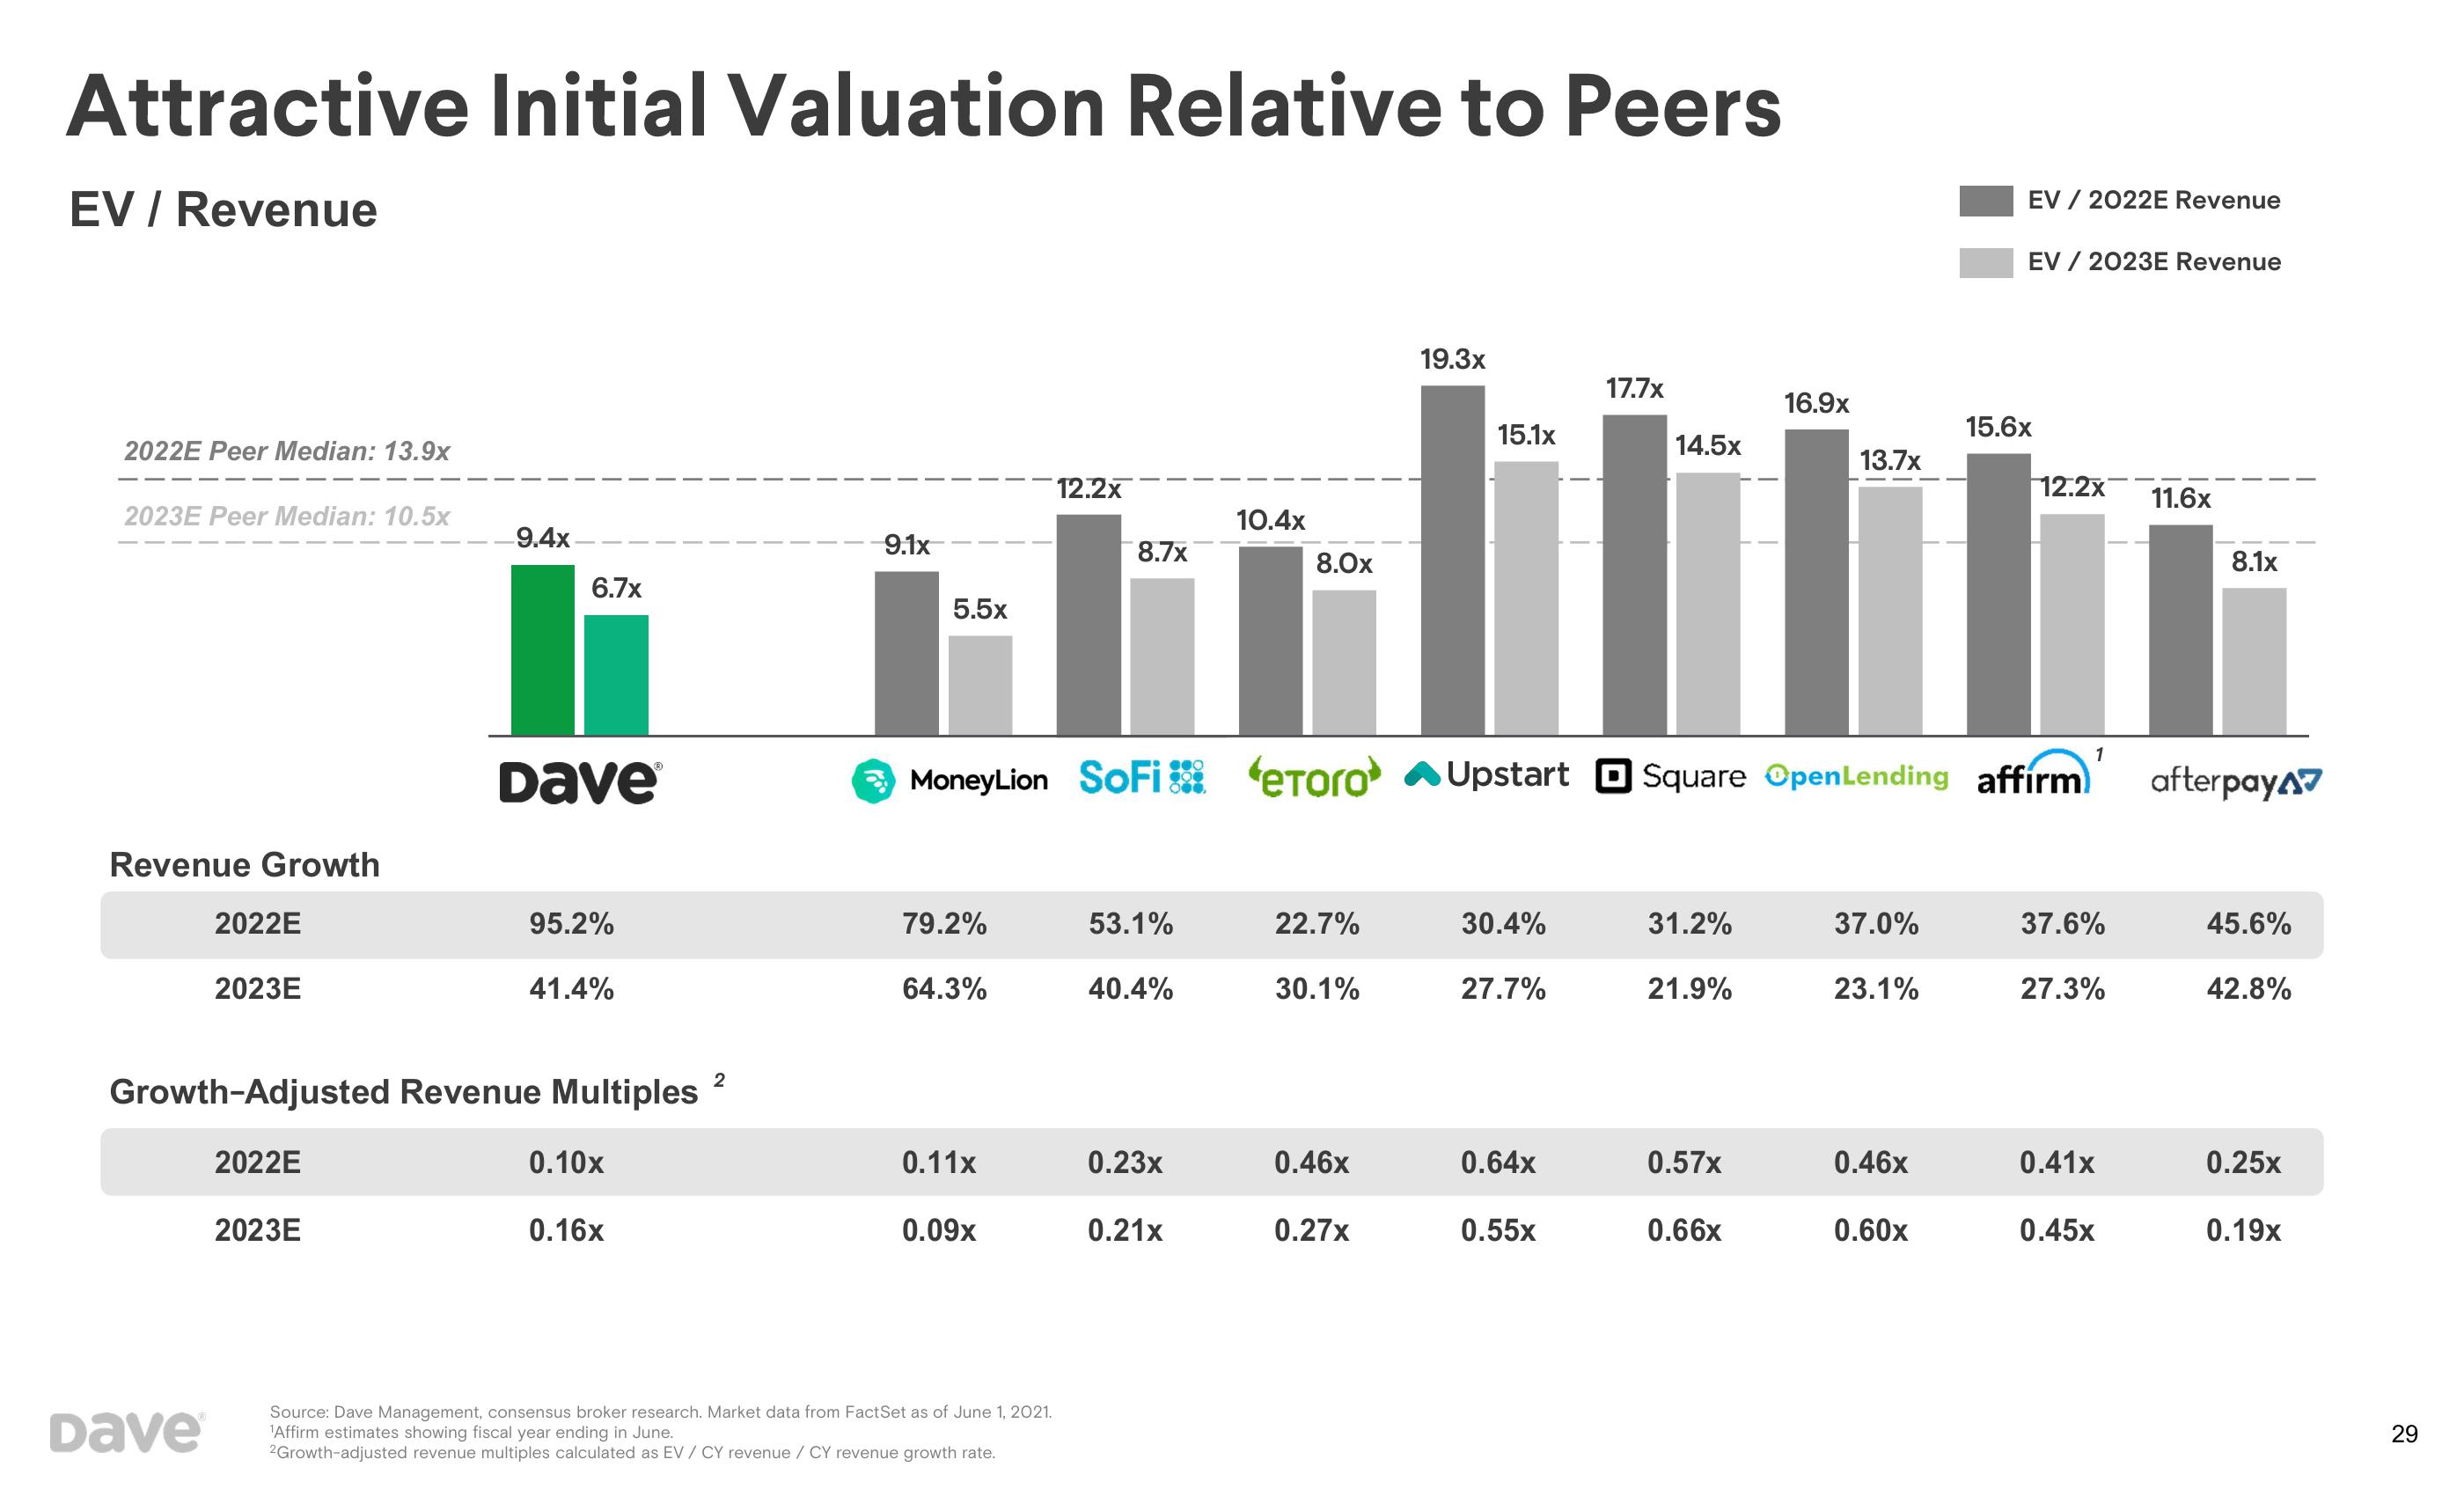
Attractive Initial Valuation Relative to Peers
EV / Revenue
2022E Peer Median: 13.9x
2023E Peer Median: 10.5x
Revenue Growth
2022E
Dave
2023E
9.4x
2023E
6.7x
Dave
95.2%
Growth-Adjusted Revenue Multiples
2022E
41.4%
0.10x
0.16x
2
9.1x
5.5x
79.2%
64.3%
0.11x
0.09x
12.2x
Source: Dave Management, consensus broker research. Market data from FactSet as of June 1, 2021.
¹Affirm estimates showing fiscal year ending in June.
2Growth-adjusted revenue multiples calculated as EV / CY revenue / CY revenue growth rate.
8.7x
53.1%
40.4%
10.4x
0.23x
0.21x
8.0x
22.7%
30.1%
19.3x
0.46x
0.27x
15.1x
MoneyLion SoFi eToro Upstart Square OpenLending affirm afterpay
30.4%
27.7%
17.7x
0.64x
0.55x
14.5×
31.2%
21.9%
0.57x
16.9x
0.66x
13.7x
37.0%
23.1%
EV / 2022E Revenue
0.46x
0.60x
EV / 2023E Revenue
15.6x
12.2x 11.6x
1
37.6%
27.3%
0.41x
0.45x
8.1x
45.6%
42.8%
0.25x
0.19x
29View entire presentation