J.P.Morgan Investment Banking
VALUATION SUMMARY
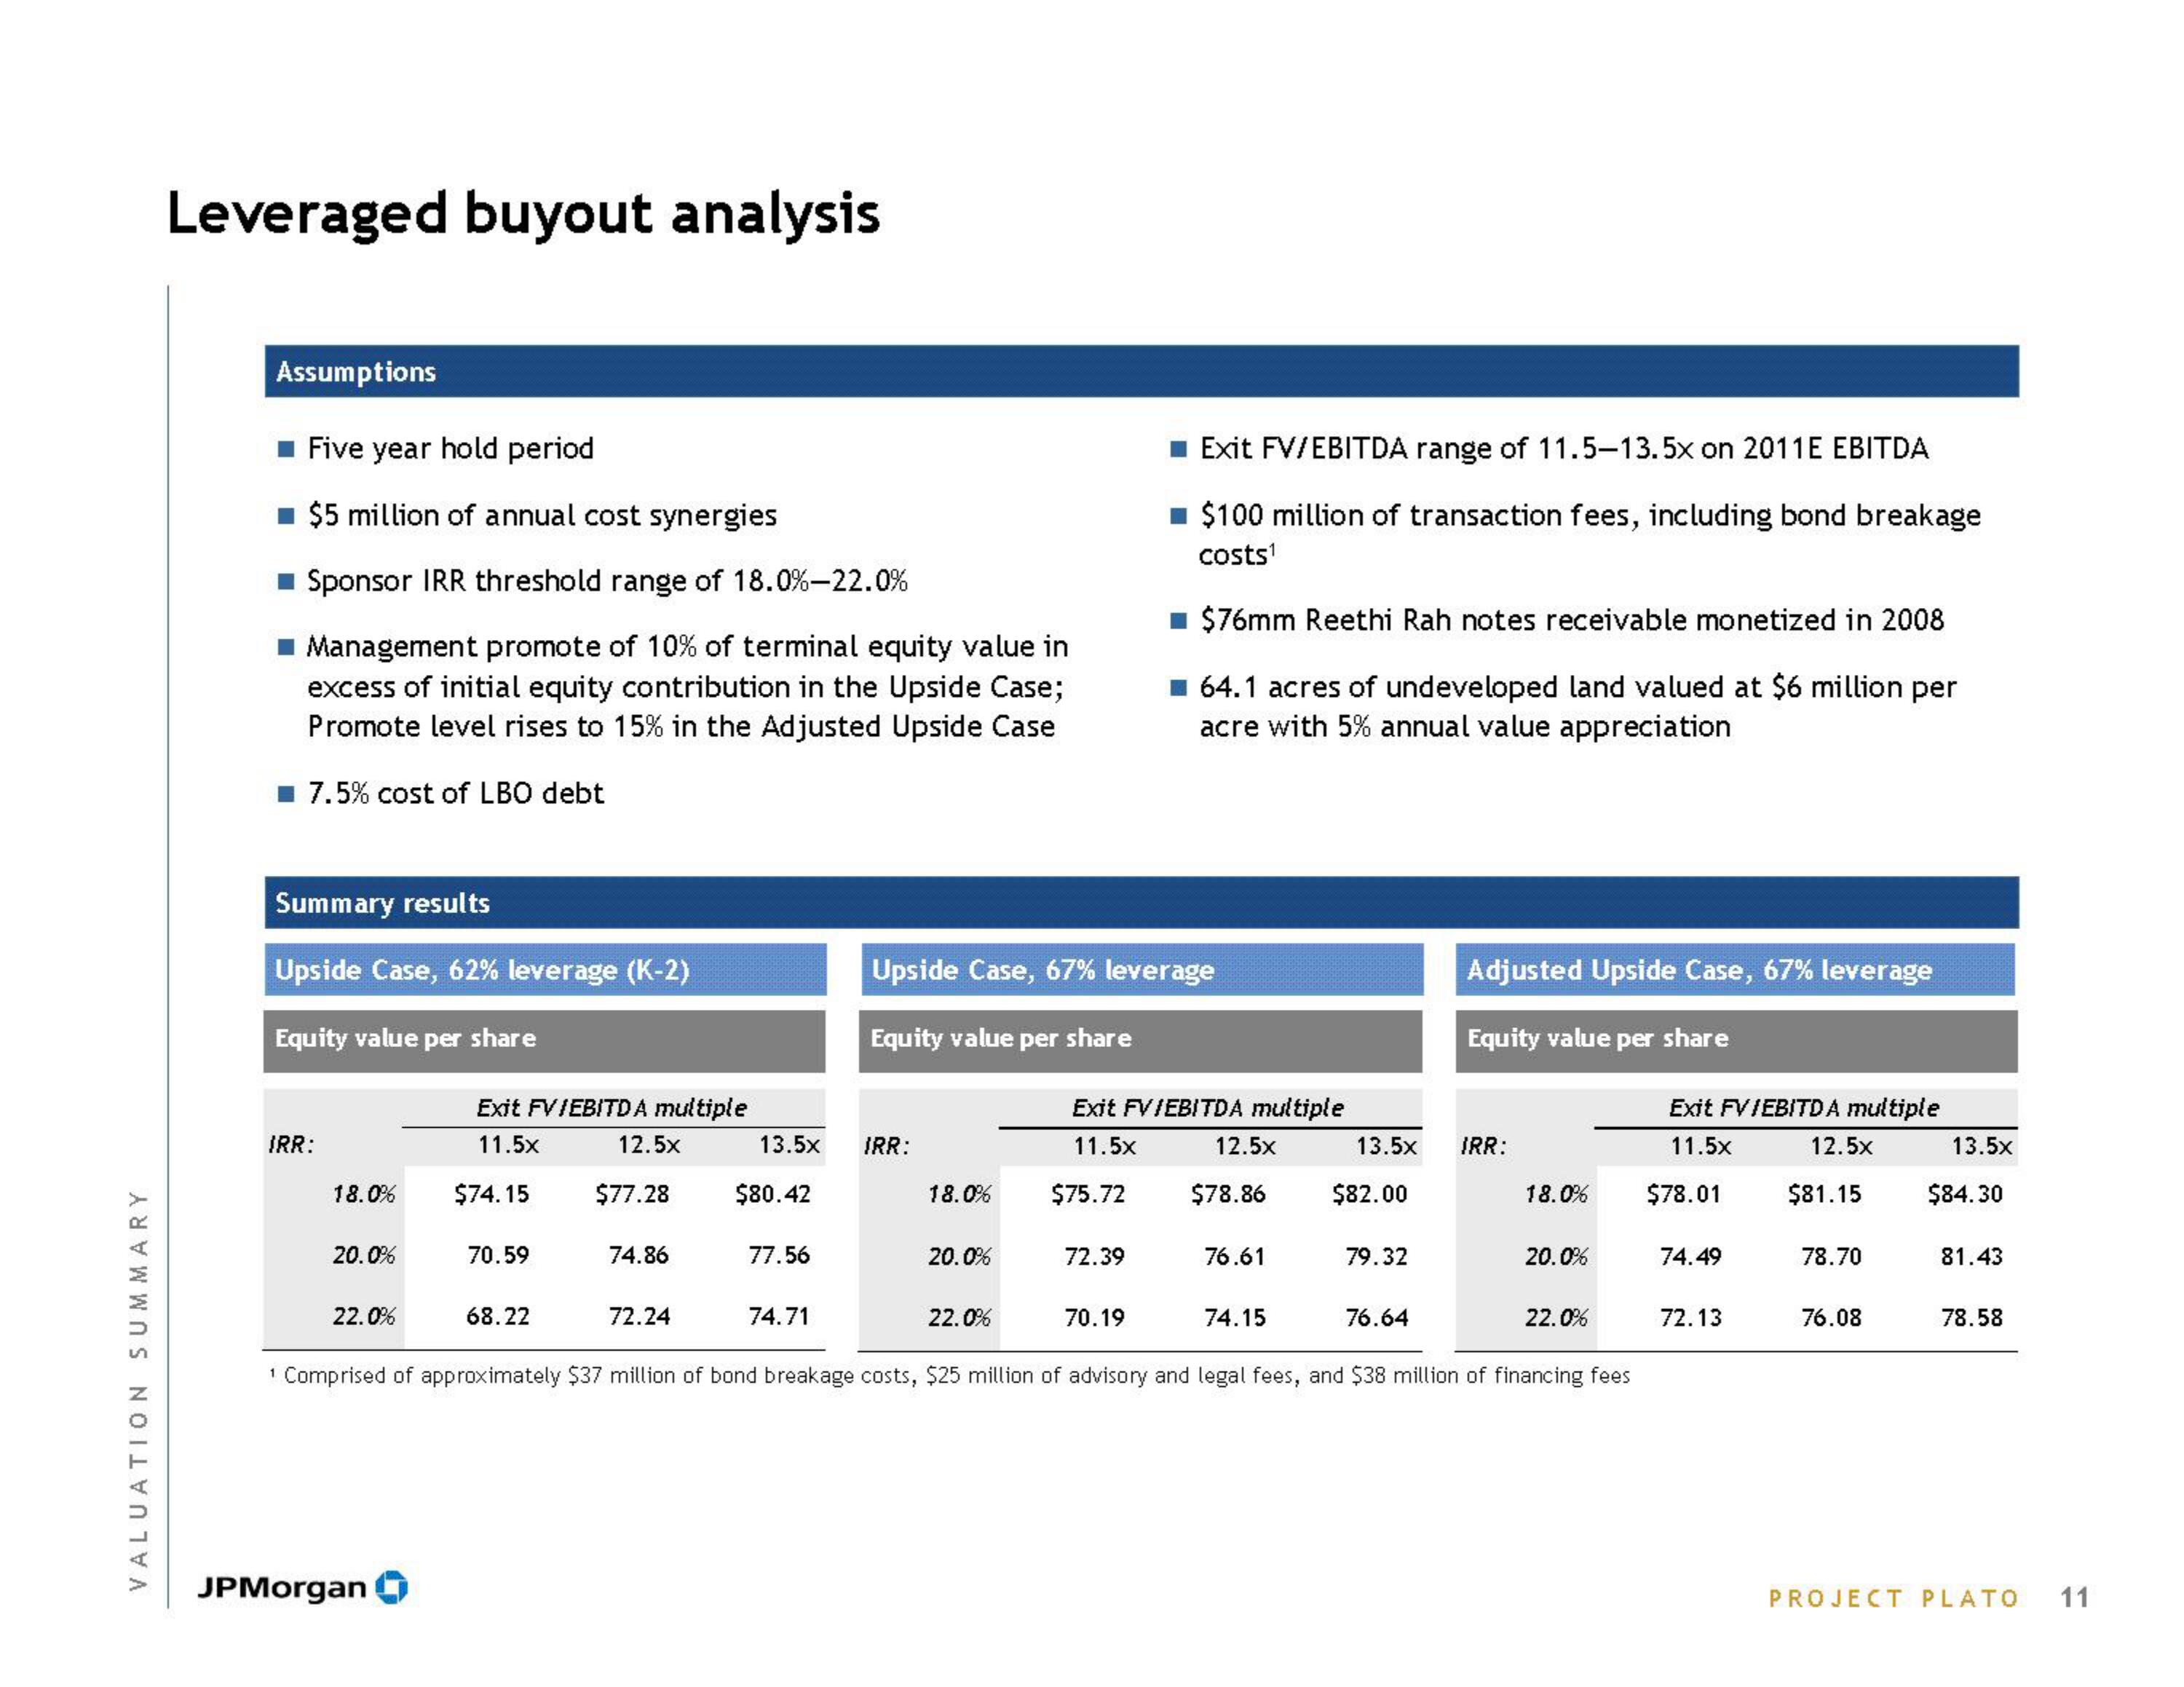
Leveraged buyout analysis
Assumptions
■ Five year hold period
■ $5 million of annual cost synergies
■ Sponsor IRR threshold range of 18.0%-22.0%
■Management promote of 10% of terminal equity value in
excess of initial equity contribution in the Upside Case;
Promote level rises to 15% in the Adjusted Upside Case
7.5% cost of LBO debt
Summary results
Upside Case, 62% leverage (K-2)
Equity value per share
IRR:
18.0%
20.0%
22.0%
Exit FVIEBITDA multiple
11.5×
JPMorgan
$74.15
70.59
68.22
12.5×
$77.28
74.86
72.24
13.5x
$80.42
77.56
74.71
IRR:
Upside Case, 67% leverage
Equity value per share
18.0%
20.0%
22.0%
$75.72
■ Exit FV/EBITDA range of 11.5-13.5x on 2011E EBITDA
$100 million of transaction fees, including bond breakage
costs¹
Exit FVIEBITDA multiple
11.5×
72.39
■ $76mm Reethi Rah notes receivable monetized in 2008
☐ 64.1 acres of undeveloped land valued at $6 million per
acre with 5% annual value appreciation
70.19
12.5×
$78.86
76.61
74.15
13.5x
$82.00
79.32
76.64
Adjusted Upside Case, 67% leverage
Equity value per share
IRR:
18.0%
20.0%
22.0%
¹ Comprised of approximately $37 million of bond breakage costs, $25 million of advisory and legal fees, and $38 million of financing fees
Exit FVIEBITDA multiple
11.5x
$78.01
74.49
72.13
12.5×
$81.15
78.70
76.08
13.5x
$84.30
81.43
78.58
PROJECT PLATO
11View entire presentation