Fort Capital Investment Banking Pitch Book
WACC Analysis
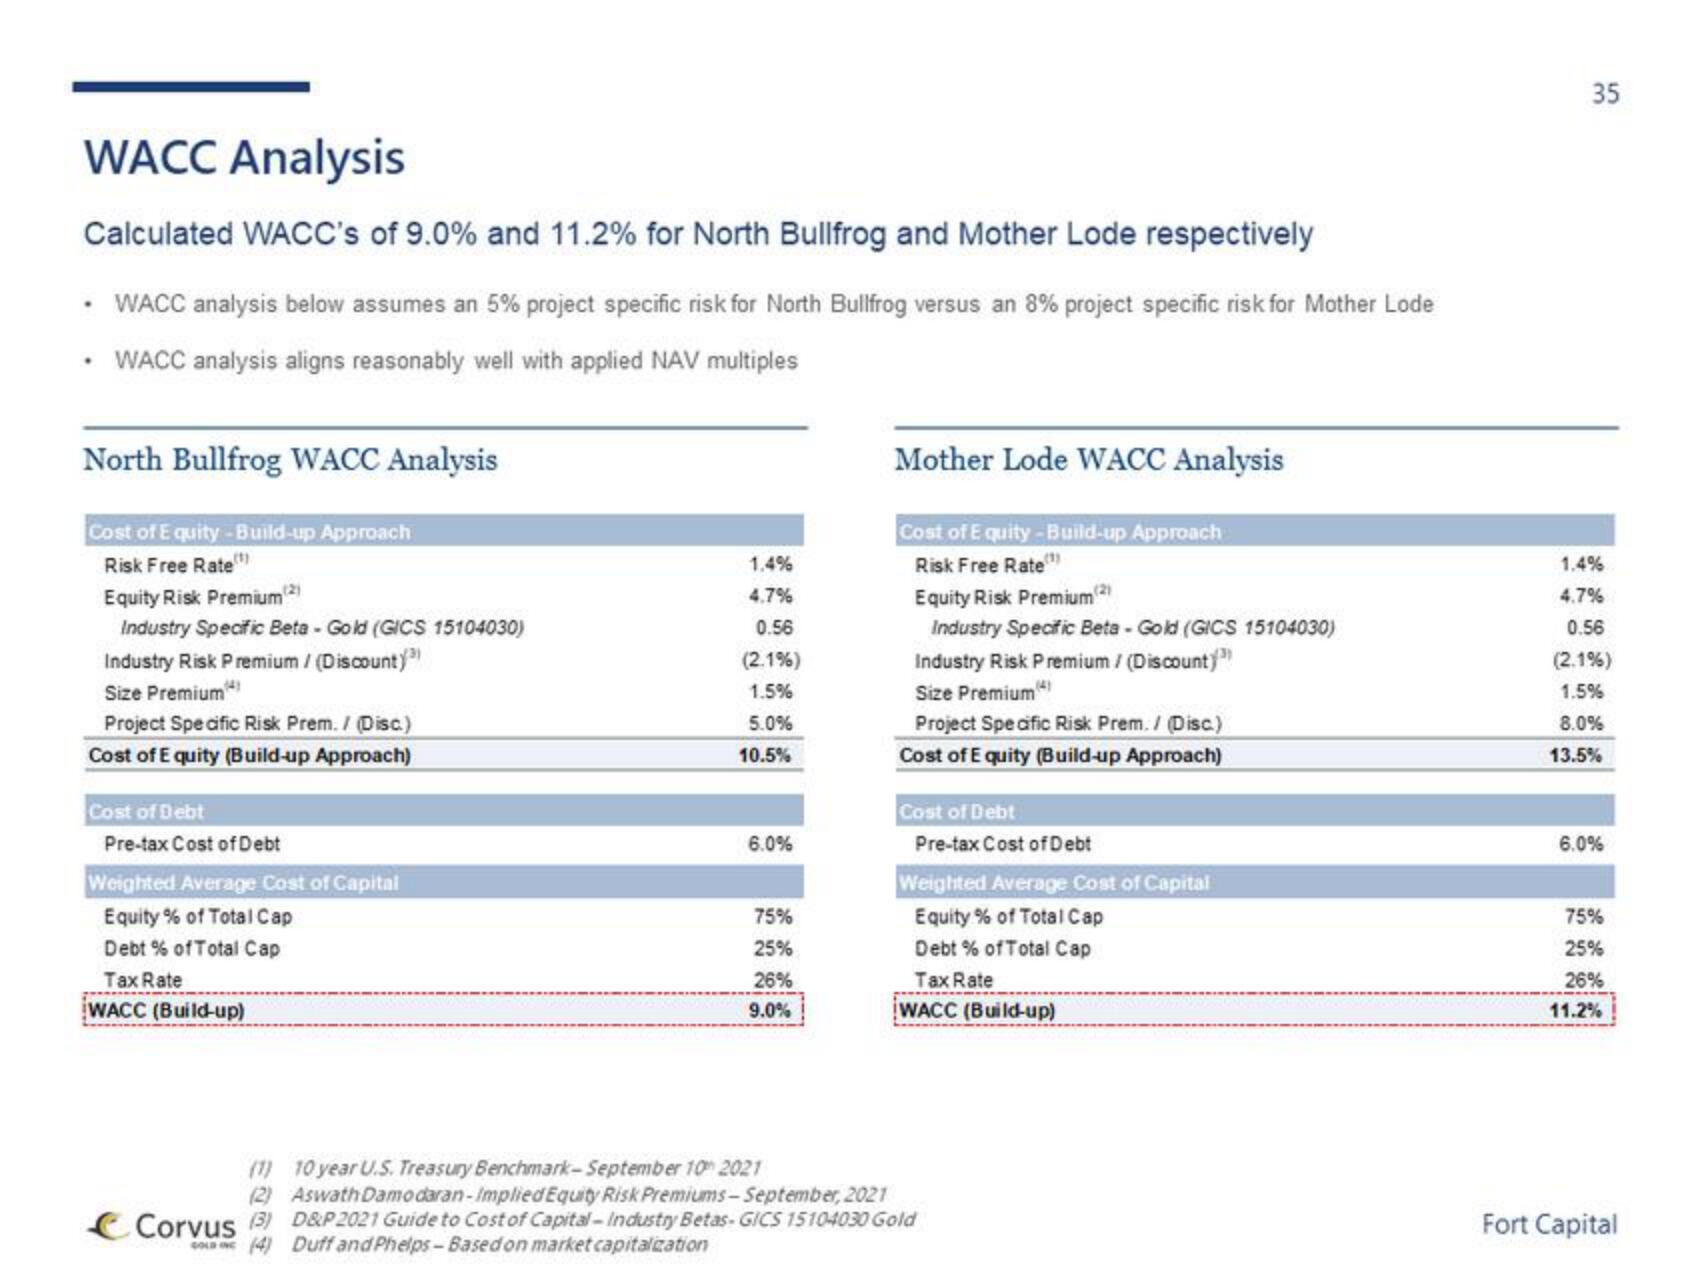
Calculated WACC's of 9.0% and 11.2% for North Bullfrog and Mother Lode respectively
WACC analysis below assumes an 5% project specific risk for North Bullfrog versus an 8% project specific risk for Mother Lode
• WACC analysis aligns reasonably well with applied NAV multiples
North Bullfrog WACC Analysis
Cost of Equity-Build-up Approach
Risk Free Rate
Equity Risk Premium (2)
Industry Specific Beta - Gold (GICS 15104030)
Industry Risk Premium / (Discount) ³)
Size Premium¹
Project Specific Risk Prem. / (Disc.)
Cost of Equity (Build-up Approach)
Cost of Debt
Pre-tax Cost of Debt
Weighted Average Cost of Capital
Equity % of Total Cap
Debt % of Total Cap
Tax Rate
WACC (Build-up)
1.4%
4.7%
0.56
(2.1%)
1.5%
5.0%
10.5%
6.0%
75%
25%
26%
9.0%
Mother Lode WACC Analysis
Cost of Equity-Build-up Approach
Risk Free Rate
Equity Risk Premium (²)
Industry Specific Beta-Gold (GICS 15104030)
Industry Risk Premium / (Discount))
Size Premium
Project Specific Risk Prem. / (Disc.)
Cost of Equity (Build-up Approach)
Cost of Debt
Pre-tax Cost of Debt
Weighted Average Cost of Capital
Equity % of Total Cap
Debt % of Total Cap
Tax Rate
WACC (Build-up)
(1)
10 year U.S. Treasury Benchmark-September 10 2021
(2)
Aswath Damodaran-Implied Equity Risk Premiums-September, 2021
Corvus (3) D&P 2021 Guide to Cost of Capital-Industry Betas- GICS 15104030 Gold
COL (4) Duff and Phelps-Based on market capitalization
35
1.4%
4.7%
0.56
(2.1%)
1.5%
8.0%
13.5%
6.0%
75%
25%
26%
11.2%
Fort CapitalView entire presentation