PowerSchool Investor Presentation Deck
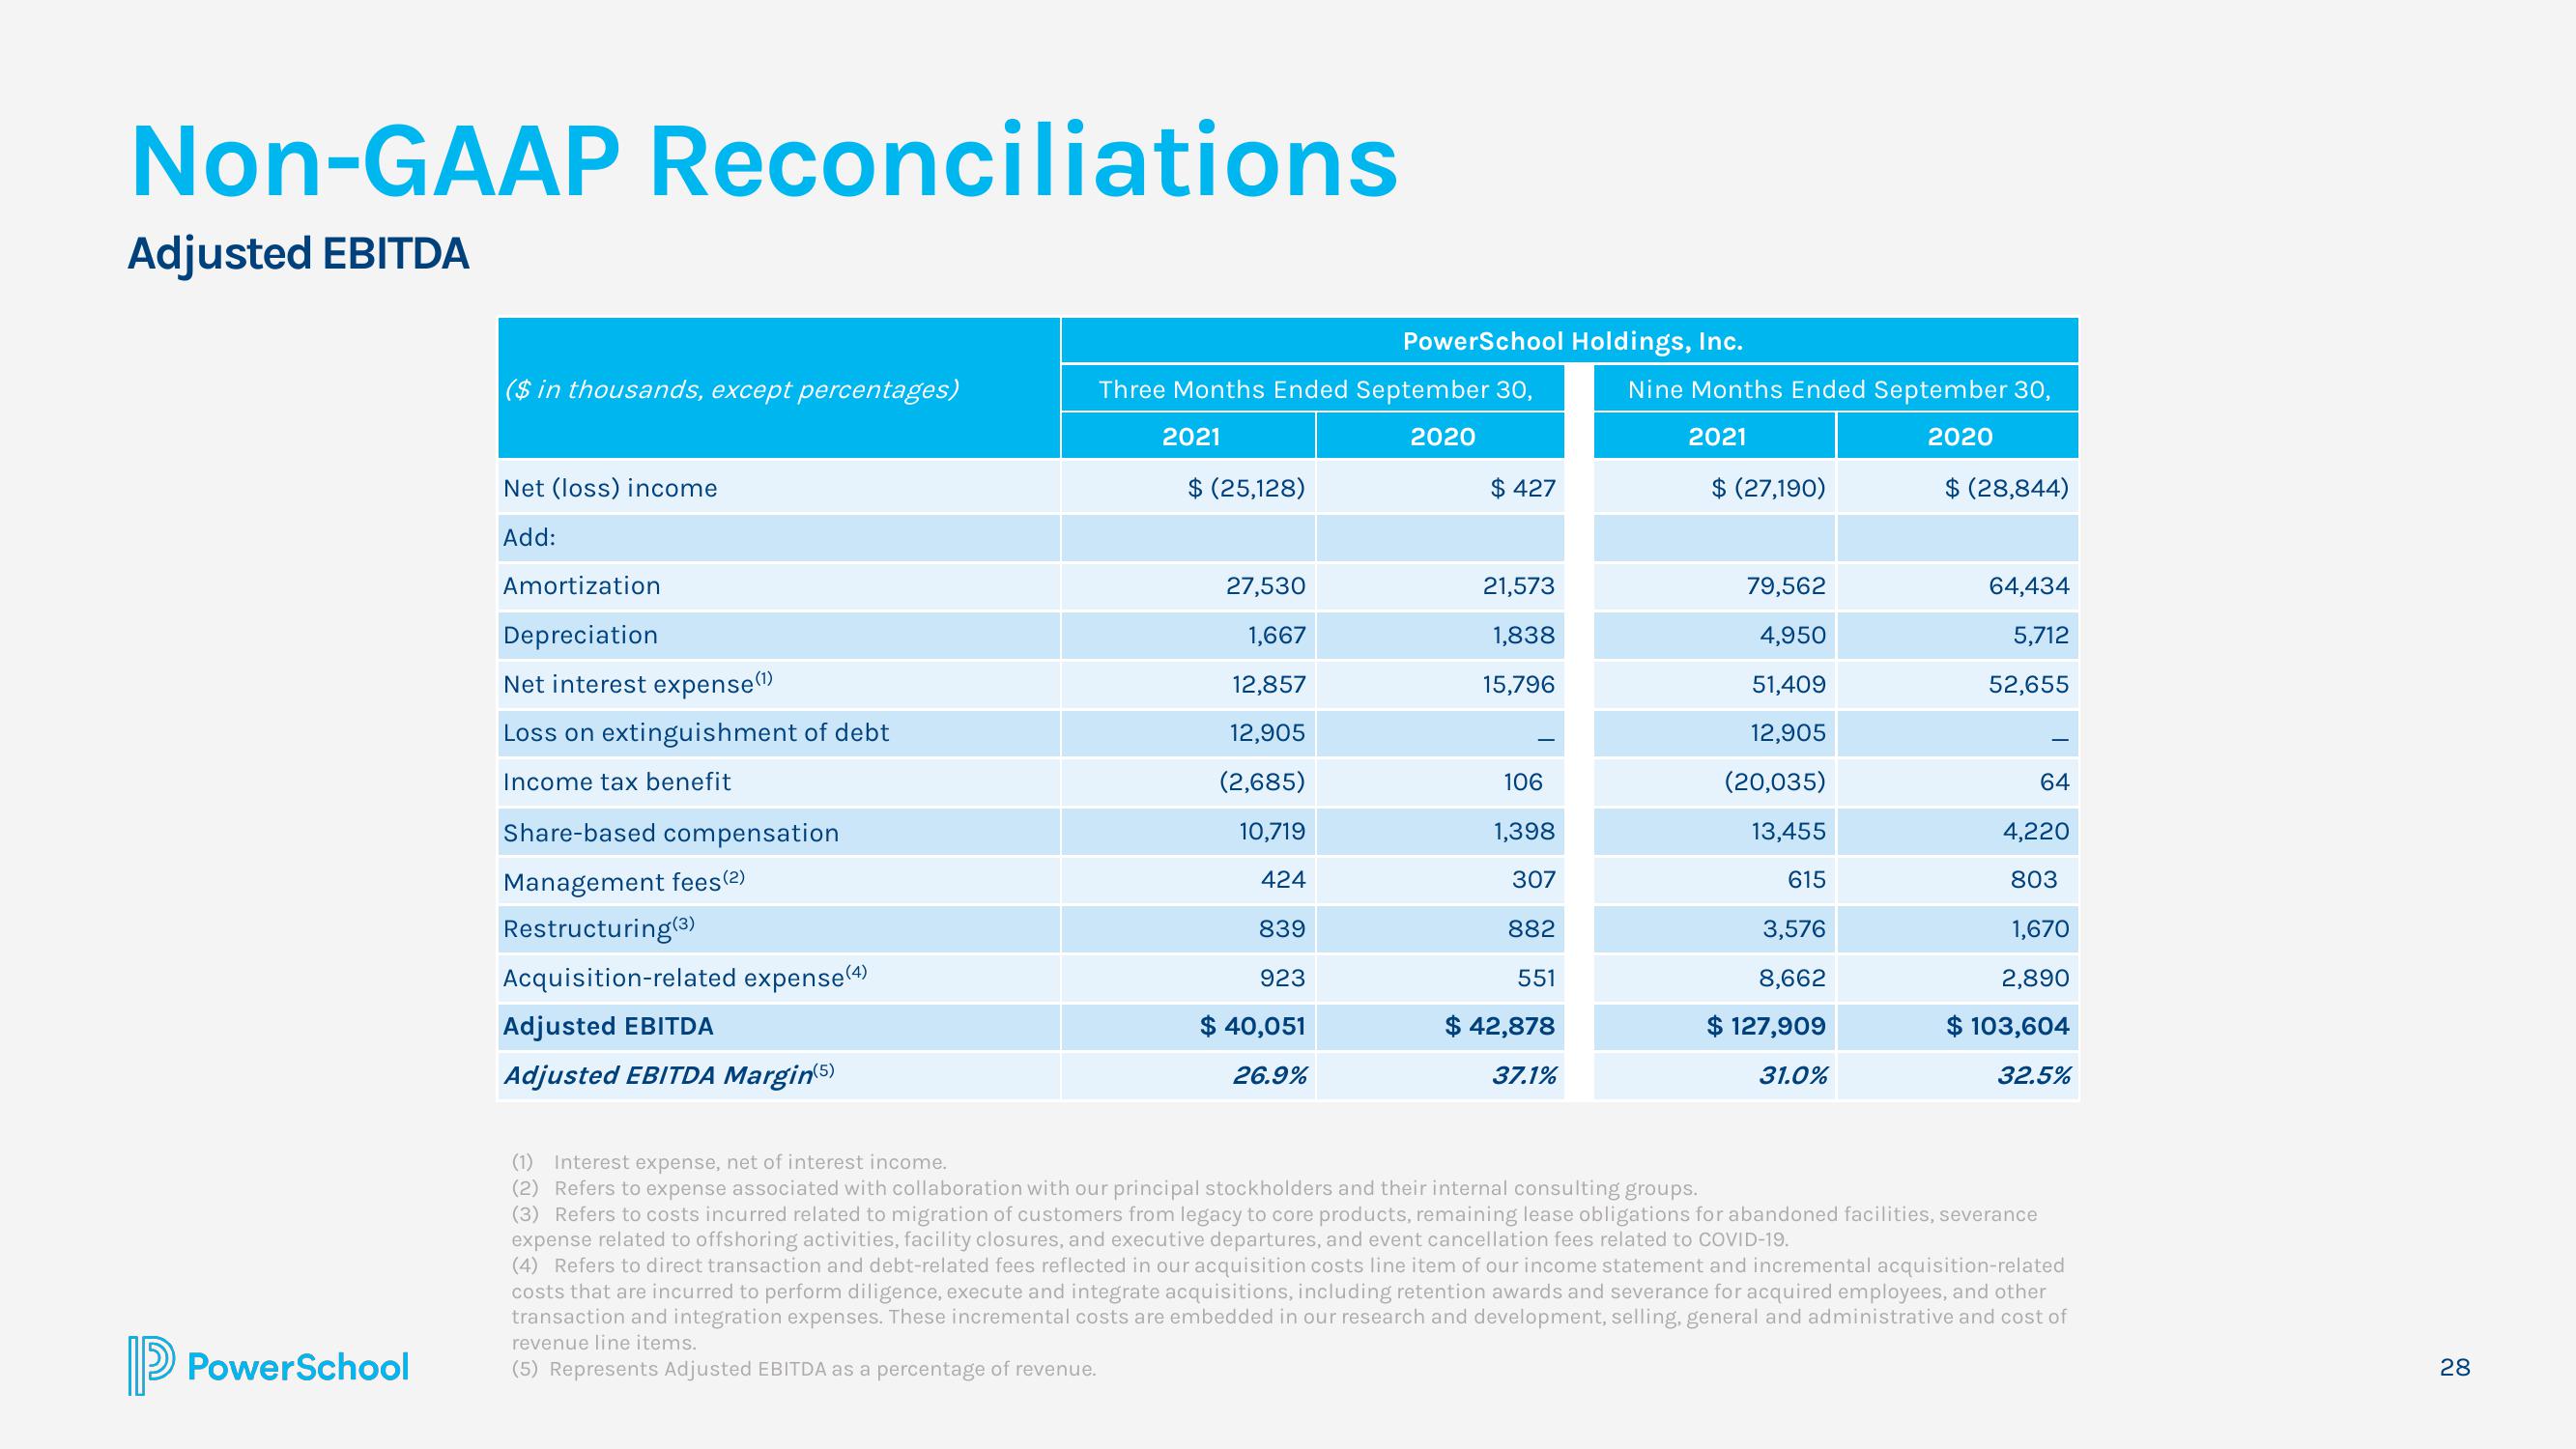
Non-GAAP Reconciliations
Adjusted EBITDA
PowerSchool
($ in thousands, except percentages)
Net (loss) income
Add:
Amortization
Depreciation
Net interest expense (¹)
Loss on extinguishment of debt
Income tax benefit
Share-based compensation
Management fees(2)
Restructuring (3)
Acquisition-related expense (4)
Adjusted EBITDA
Adjusted EBITDA Margin(5)
Three Months Ended September 30,
2020
2021
$ (25,128)
PowerSchool Holdings, Inc.
27,530
1,667
12,857
12,905
(2,685)
10,719
424
839
923
$ 40,051
26.9%
$ 427
21,573
1,838
15,796
106
1,398
307
882
551
$ 42,878
37.1%
Nine Months Ended September 30,
2021
2020
$ (27,190)
(1) Interest expense, net of interest income.
(2) Refers to expense associated with collaboration with our principal stockholders and their internal consulting groups.
79,562
4,950
51,409
12,905
(20,035)
13,455
615
3,576
8,662
$ 127,909
31.0%
$ (28,844)
64,434
5,712
52,655
64
4,220
803
1,670
2,890
$ 103,604
32.5%
(3) Refers to costs incurred related to migration of customers from legacy to core products, remaining lease obligations for abandoned facilities, severance
expense related to offshoring activities, facility closures, and executive departures, and event cancellation fees related to COVID-19.
(4) Refers to direct transaction and debt-related fees reflected in our acquisition costs line item of our income statement and incremental acquisition-related
costs that are incurred to perform diligence, execute and integrate acquisitions, including retention awards and severance for acquired employees, and other
transaction and integration expenses. These incremental costs are embedded in our research and development, selling, general and administrative and cost of
revenue line items.
(5) Represents Adjusted EBITDA as a percentage of revenue.
28View entire presentation