NuStar Energy Investor Conference Presentation Deck
NuStar
Reconciliation of Non-GAAP Financial
Information (continued)
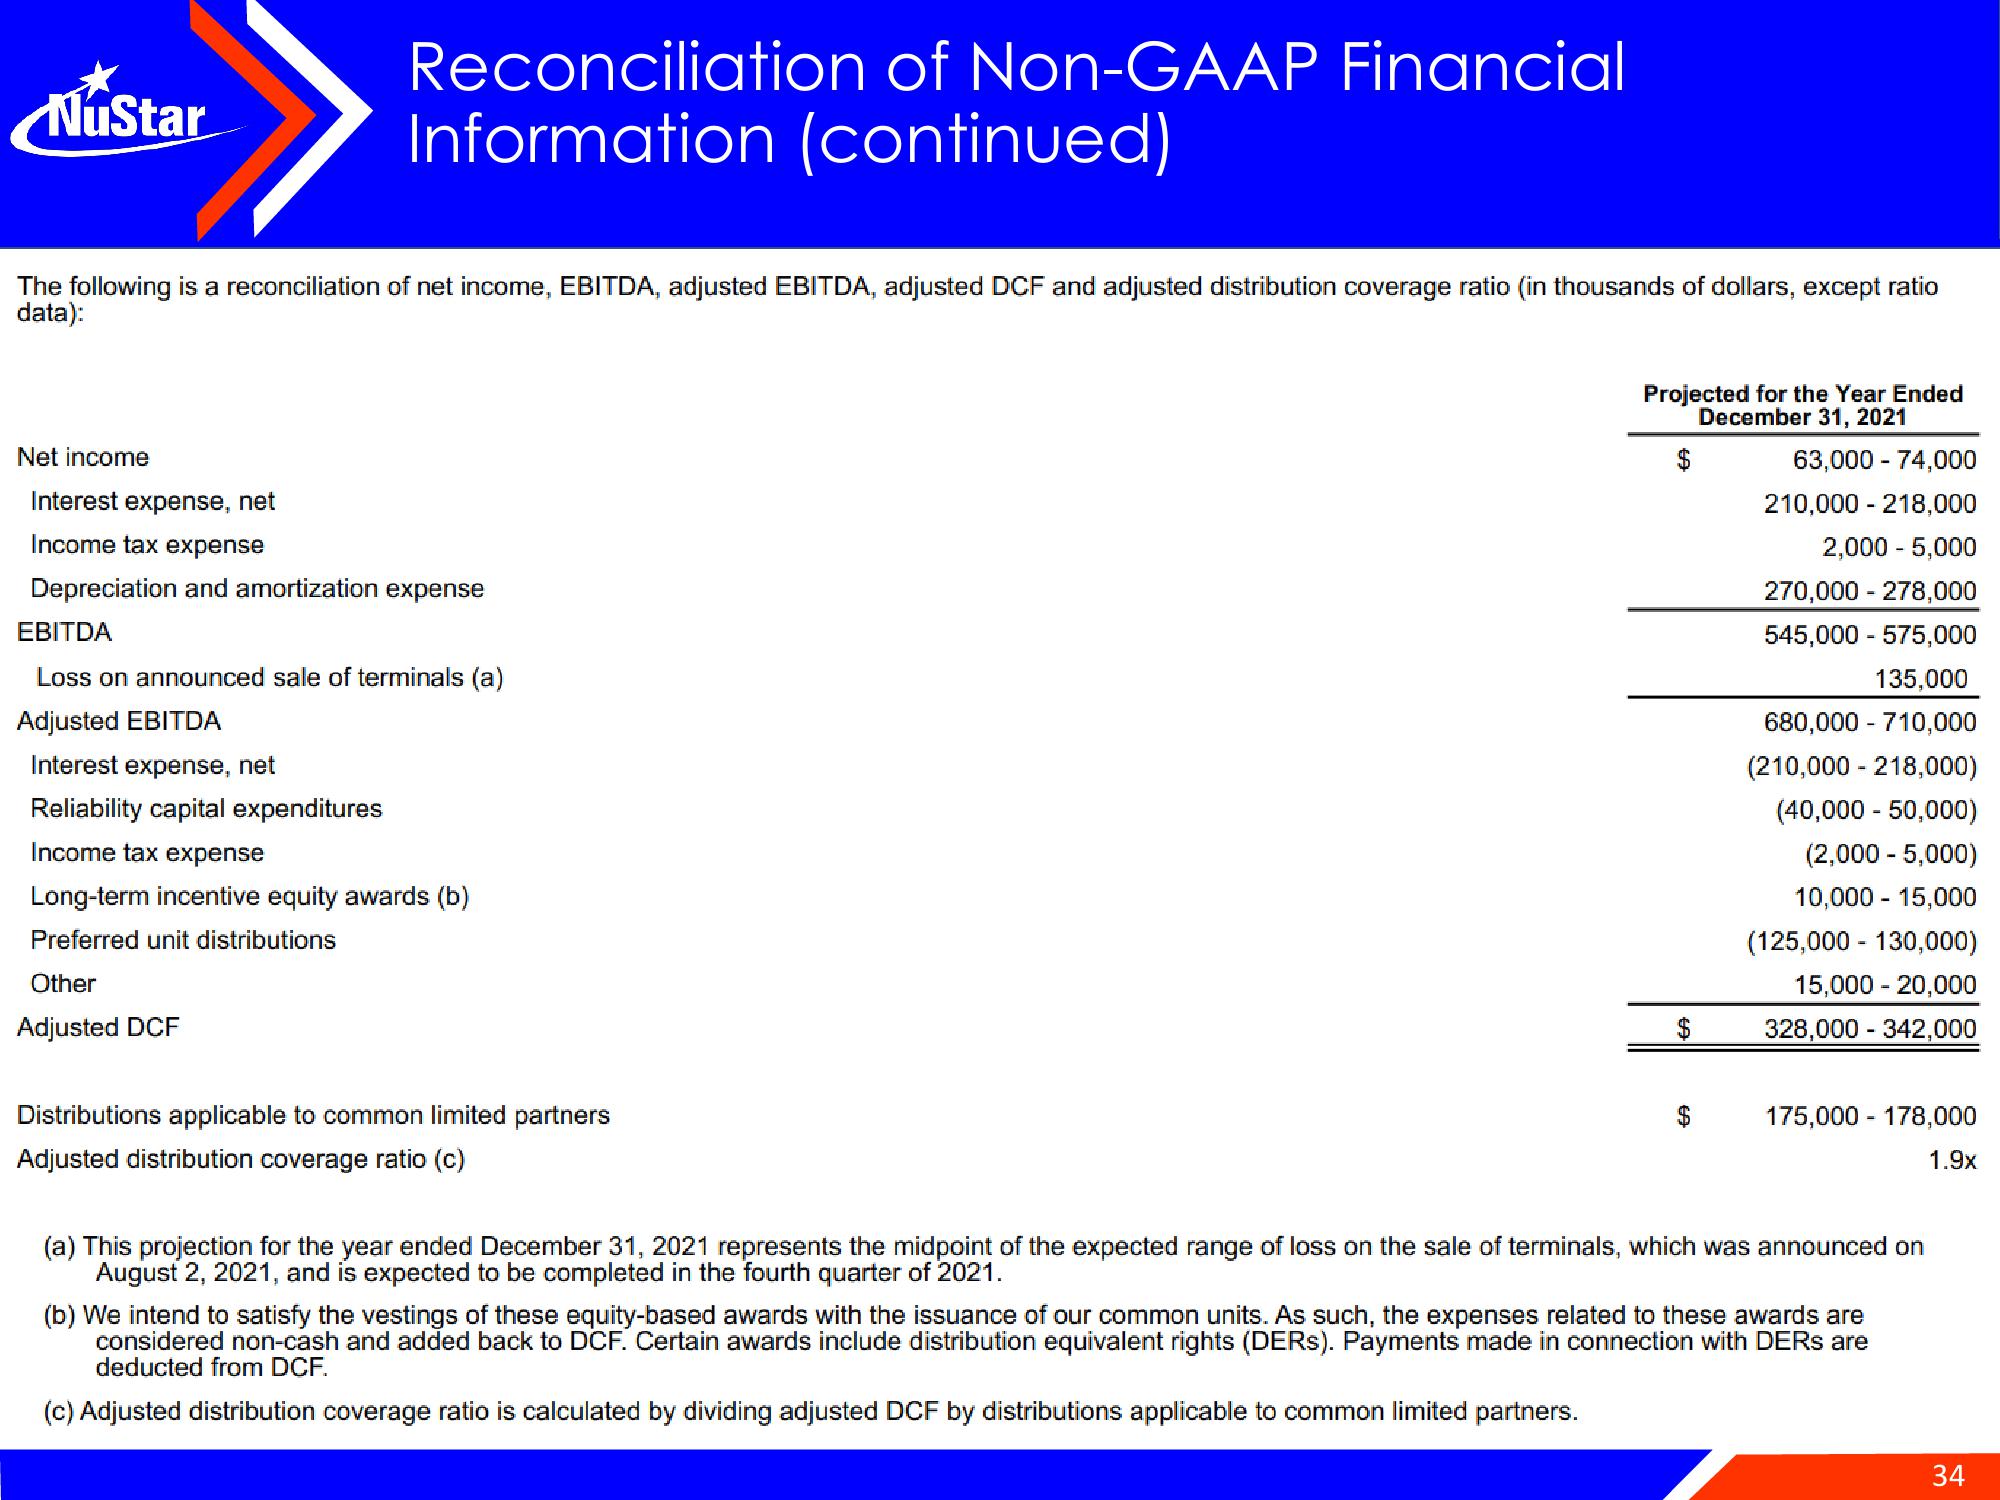
The following is a reconciliation of net income, EBITDA, adjusted EBITDA, adjusted DCF and adjusted distribution coverage ratio (in thousands of dollars, except ratio
data):
Net income
Interest expense, net
Income tax expense
Depreciation and amortization expense
EBITDA
Loss on announced sale of terminals (a)
Adjusted EBITDA
Interest expense, net
Reliability capital expenditures
Income tax expense
Long-term incentive equity awards (b)
Preferred unit distributions
Other
Adjusted DCF
Distributions applicable to common limited partners
Adjusted distribution coverage ratio (c)
Projected for the Year Ended
December 31, 2021
$
63,000 - 74,000
210,000 218,000
2,000 - 5,000
270,000 -278,000
545,000 - 575,000
135,000
680,000 - 710,000
(210,000 - 218,000)
(40,000 - 50,000)
(2,000 - 5,000)
10,000 15,000
(125,000 - 130,000)
15,000 - 20,000
328,000 342,000
$
175,000 178,000
1.9x
(a) This projection for the year ended December 31, 2021 represents the midpoint of the expected range of loss on the sale of terminals, which was announced on
August 2, 2021, and is expected to be completed in the fourth quarter of 2021.
(b) We intend to satisfy the vestings of these equity-based awards with the issuance of our common units. As such, the expenses related to these awards are
considered non-cash and added back to DCF. Certain awards include distribution equivalent rights (DERs). Payments made in connection with DERS are
deducted from DCF.
(c) Adjusted distribution coverage ratio is calculated by dividing adjusted DCF by distributions applicable to common limited partners.
34View entire presentation