Amplitude Results Presentation Deck
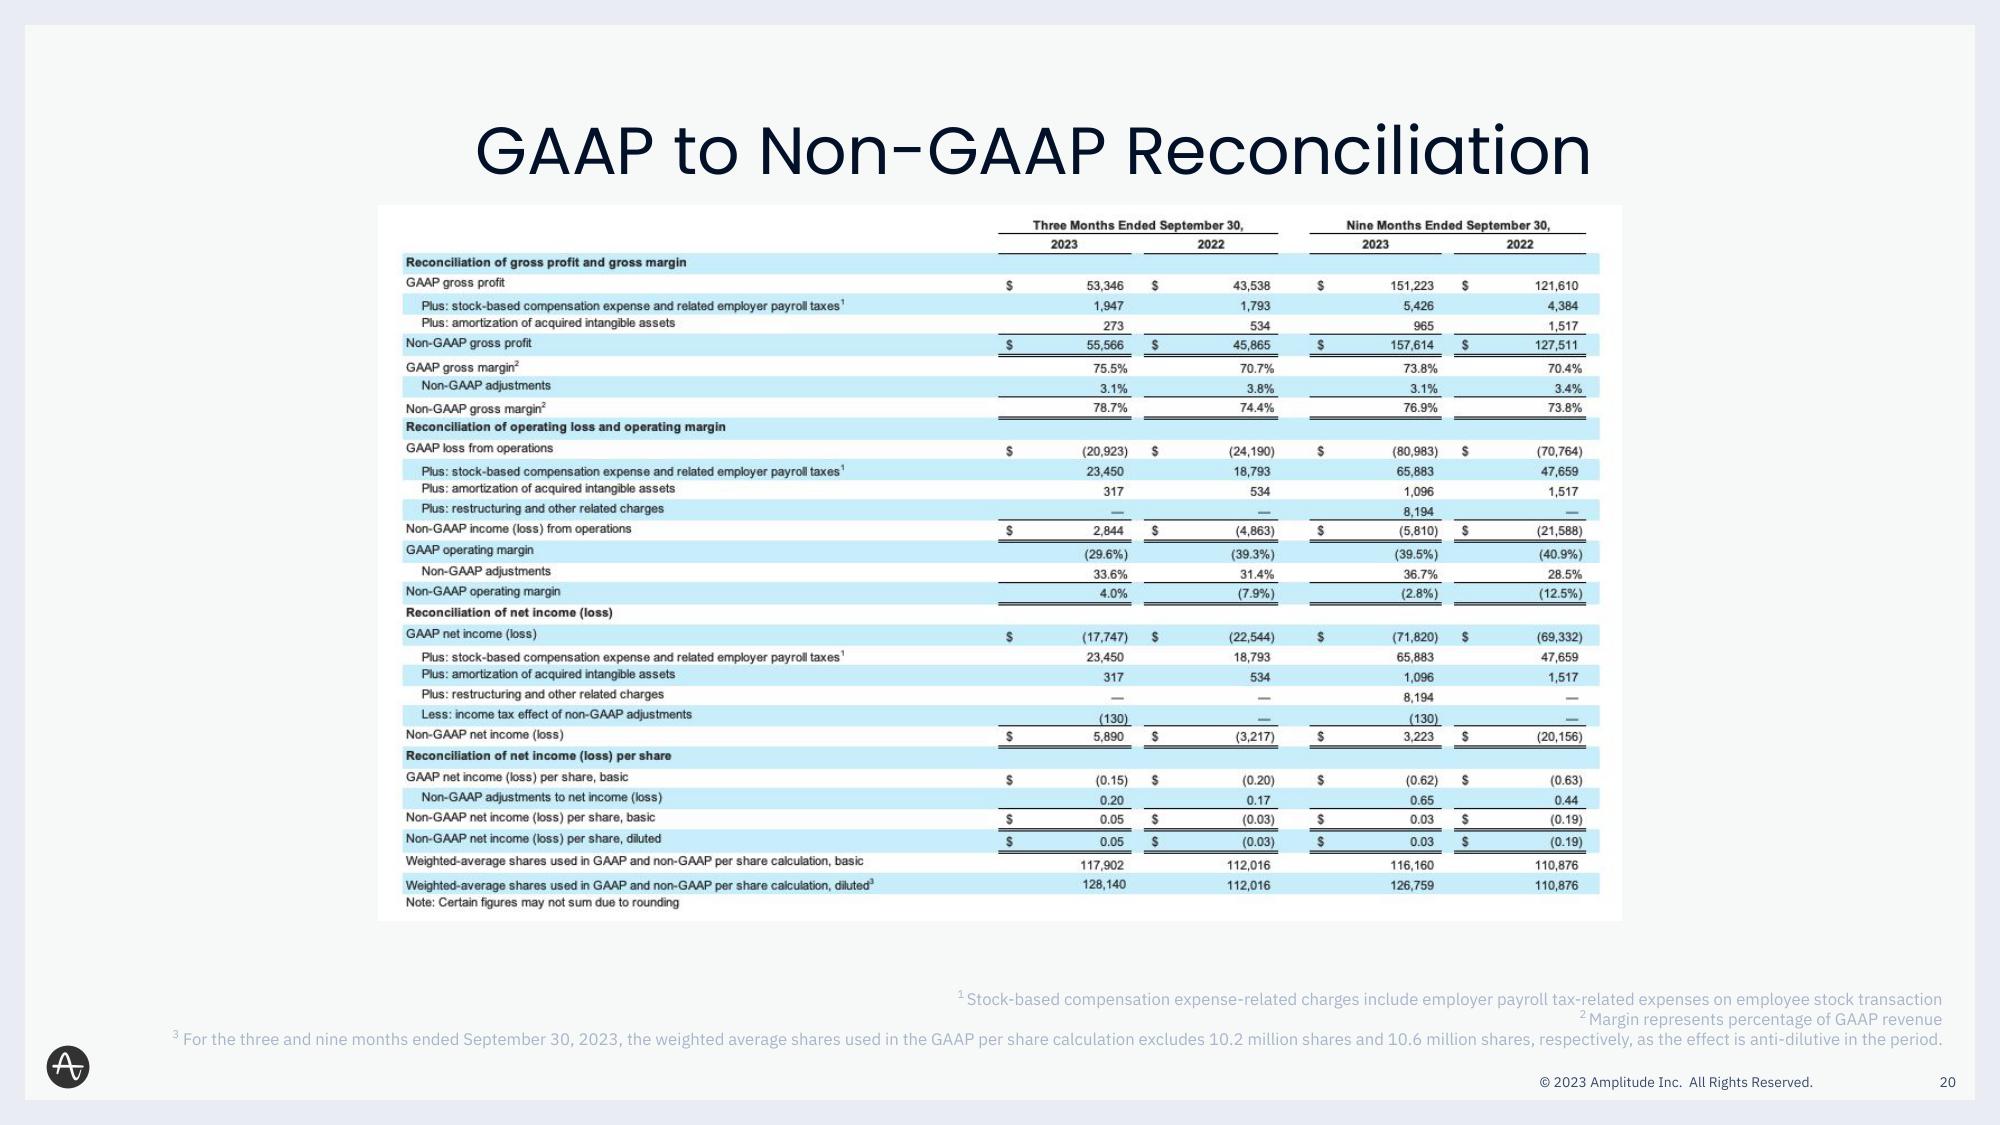
GAAP to Non-GAAP Reconciliation
Nine Months Ended September 30,
2023
2022
Reconciliation of gross profit and gross margin
GAAP gross profit
Plus: stock-based compensation expense and related employer payroll taxes¹
Plus: amortization of acquired intangible assets
Non-GAAP gross profit
GAAP gross margin²
Non-GAAP adjustments
Non-GAAP gross margin²
Reconciliation of operating loss and operating margin
GAAP loss from operations
Plus: stock-based compensation expense and related employer payroll taxes¹
Plus: amortization of acquired intangible assets
Plus: restructuring and other related charges
Non-GAAP income (loss) from operations
GAAP operating margin
Non-GAAP adjustments
Non-GAAP operating margin
Reconciliation of net income (loss)
GAAP net income (loss)
Plus: stock-based compensation expense and related employer payroll taxes¹
Plus: amortization of acquired intangible assets
Plus: restructuring and other related charges
Less: income tax effect of non-GAAP adjustments
Non-GAAP net income (loss)
Reconciliation of net income (loss) per share
GAAP net income (loss) per share, basic
Non-GAAP adjustments to net income (loss)
Non-GAAP net income (loss) per share, basic
Non-GAAP net income (loss) per share, diluted
Weighted-average shares used in GAAP and non-GAAP per share calculation, basic
Weighted-average shares used in GAAP and non-GAAP per share calculation, diluted
Note: Certain figures may not sum due to rounding
$
S
S
$
S
Three Months Ended September 30,
2023
2022
53,346 S
1,947
273
55,566
75.5%
3.1%
78.7%
(20,923) $
23,450
317
2.844
(29.6%)
33.6%
4.0%
(17,747)
23,450
317
(130)
5,890
$
117,902
128,140
$
S
(0.15) $
0.20
0.05
0.05
$
S
43,538
1,793
534
45,865
70.7%
3.8%
74.4%
(24,190)
18,793
534
(4,863)
(39.3%)
31.4%
(7.9%)
(22,544)
18,793
534
(3,217)
(0.20)
0.17
(0.03)
(0.03)
112,016
112,016
$
$
$
$
$
$
$
$
$
151,223 $
5,426
965
157,614
73.8%
3.1%
76.9%
(80,983)
65,883
1,096
8,194
(5,810)
(39.5%)
36.7%
(2.8%)
(71,820)
65,883
1,096
8,194
(130)
3,223
(0.62)
0.65
0.03
0.03
116,160
126,759
$
S
$
S
$
$
S
121,610
4,384
1,517
127,511
70.4%
3.4%
73.8%
(70,764)
47,659
1,517
(21,588)
(40.9%)
28.5%
(12.5%)
(69,332)
47,659
1,517
(20,156)
(0.63)
0.44
(0.19)
(0.19)
110,876
110,876
¹ Stock-based compensation expense-related charges include employer payroll tax-related expenses on employee stock transaction
2 Margin represents percentage of GAAP revenue
3
For the three and nine months ended September 30, 2023, the weighted average shares used in the GAAP per share calculation excludes 10.2 million shares and 10.6 million shares, respectively, as the effect is anti-dilutive in the period.
© 2023 Amplitude Inc. All Rights Reserved.
20View entire presentation