Ready Capital Investor Presentation Deck
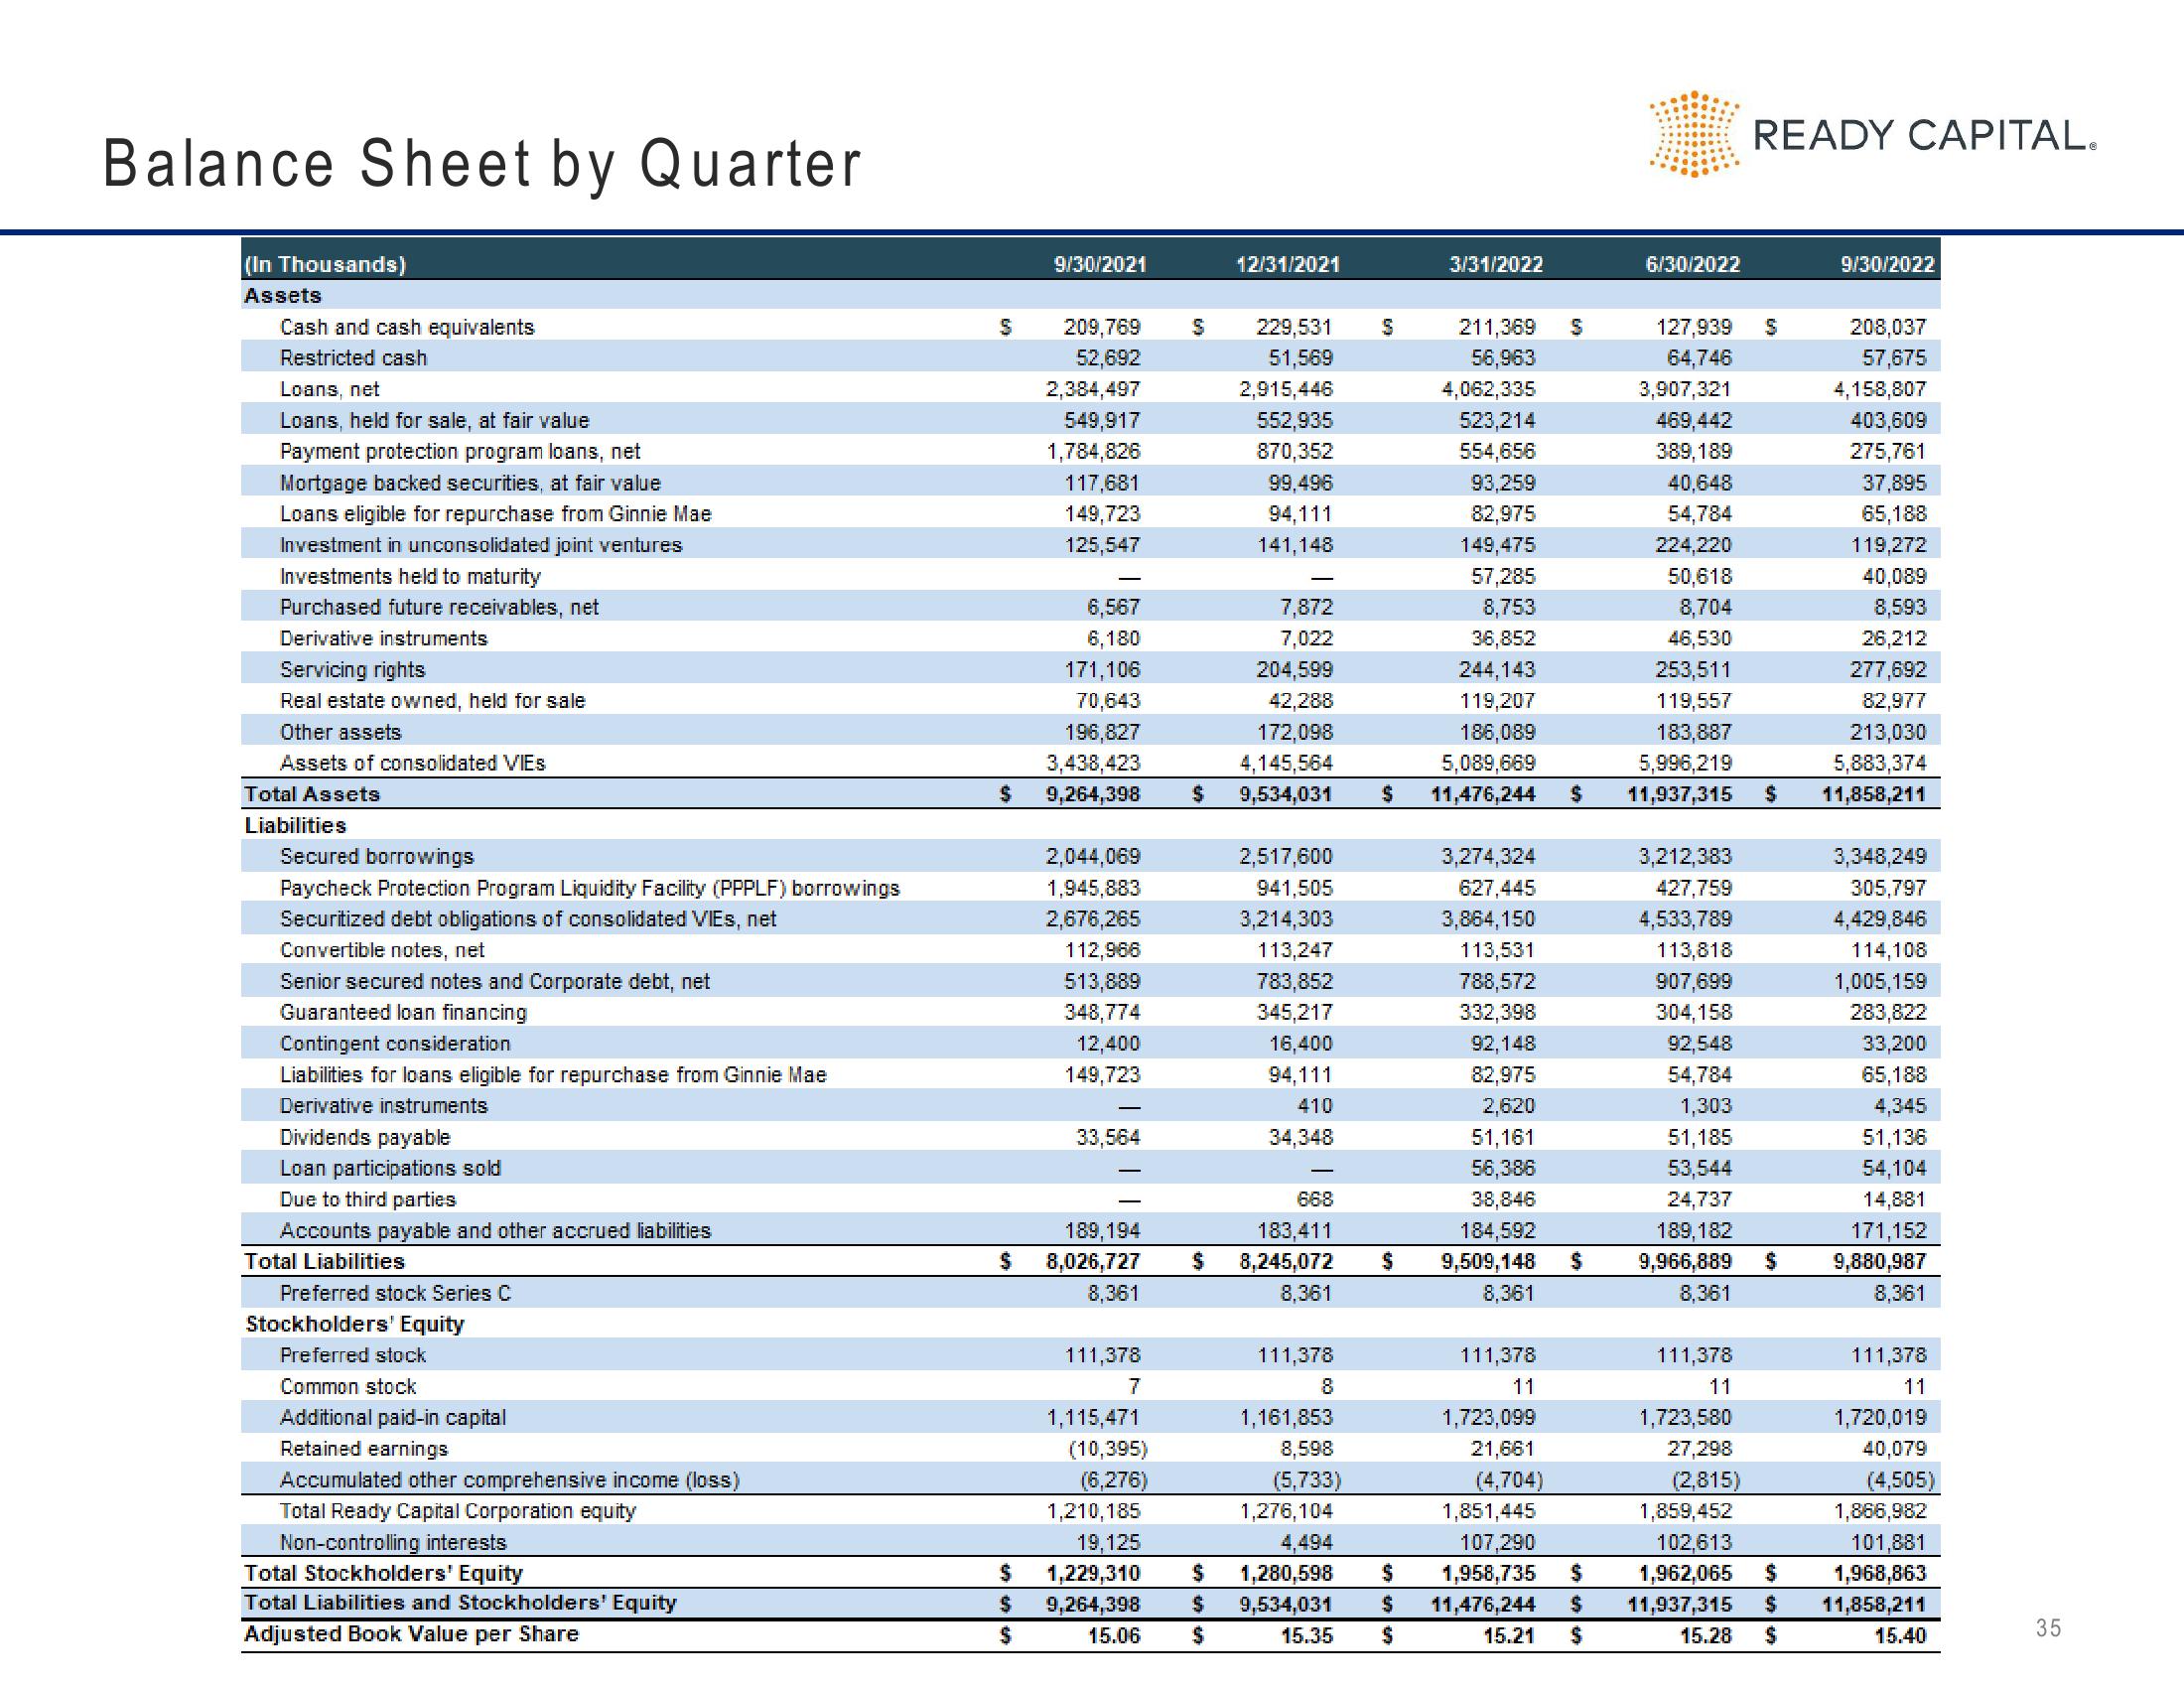
Balance Sheet by Quarter
(In Thousands)
Assets
Cash and cash equivalents
Restricted cash
Loans, net
Loans, held for sale, at fair value
Payment protection program loans, net
Mortgage backed securities, at fair value
Loans eligible for repurchase from Ginnie Mae
Investment in unconsolidated joint ventures
Investments held to maturity
Purchased future receivables, net
Derivative instruments
Servicing rights
Real estate owned, held for sale
Other assets
Assets of consolidated VIES
Total Assets
Liabilities
Secured borrowings
Paycheck Protection Program Liquidity Facility (PPPLF) borrowings
Securitized debt obligations of consolidated VIEs, net
Convertible notes, net
Senior secured notes and Corporate debt, net
Guaranteed loan financing
Contingent consideration
Liabilities for loans eligible for repurchase from Ginnie Mae
Derivative instruments
Dividends payable
Loan participations sold
Due to third parties
Accounts payable and other accrued liabilities
Total Liabilities
Preferred stock Series C
Stockholders' Equity
Preferred stock
Common stock
Additional paid-in capital
Retained earnings
Accumulated other comprehensive income (loss)
Total Ready Capital Corporation equity
Non-controlling interests
Total Stockholders' Equity
Total Liabilities and Stockholders' Equity
Adjusted Book Value per Share
S
$
9/30/2021
209,769
52,692
2,384,497
549,917
1,784,826
117,681
149,723
125,547
6,567
6,180
171,106
70,643
196,827
3,438,423
9,264,398
2,044,069
1,945,883
2,676,265
112,966
513,889
348,774
12,400
149,723
-
33,564
189,194
$ 8,026,727
8,361
111,378
7
1,115,471
(10,395)
(6,276)
1,210,185
19,125
$
$ 1,229,310
9,264,398
15.06
$
12/31/2021
S 229,531
51,569
2,915,446
552,935
870,352
99,496
94,111
141,148
211,369
56,963
4,062,335
523,214
554,656
93,259
82,975
149,475
57,285
8,753
36,852
46,530
204,599
244,143
253,511
42,288
119,207
119,557
172,098
4,145,564
186,089
5,089,669
183,887
5,996,219
$ 9,534,031 $ 11,476,244 $ 11,937,315 $
7,872
7,022
2,517,600
941,505
3,214,303
113,247
783,852
345,217
16,400
94,111
410
34,348
668
183,411
$ 8,245,072 $
8,361
111,378
8
3/31/2022
1,161,853
8,598
(5,733)
1,276,104
4,494
$ 1,280,598
$ 9,534,031
$
15.35
3,274,324
627,445
3,864,150
113,531
788,572
332,398
92,148
82,975
2,620
51,161
56,386
38,846
184,592
9,509,148
8,361
111,378
11
1,723,099
21,661
(4,704)
1,851,445
107,290
6/30/2022
$ 1,958,735 $
$ 11,476,244 $
$
15.21 $
127,939
64,746
3,907,321
469,442
389,189
40,648
54,784
224,220
50,618
8,704
3,212,383
427,759
4,533,789
READY CAPITAL.
113,818
907,699
304,158
92,548
54,784
1,303
51,185
53,544
24,737
189,182
$ 9,966,889 $
8,361
111,378
11
1,723,580
27,298
(2,815)
1,859,452
102,613
1,962,065 $
11,937,315 $
15.28 $
9/30/2022
208,037
57,675
4,158,807
403,609
275,761
37,895
65,188
119,272
40,089
8,593
26,212
277,692
82,977
213,030
5,883,374
11,858,211
3,348,249
305,797
4,429,846
114,108
1,005,159
283,822
33,200
65,188
4,345
51,136
54,104
14,881
171,152
9,880,987
8,361
111,378
11
1,720,019
40,079
(4,505)
1,866,982
101,881
1,968,863
11,858,211
15.40
35View entire presentation