Astra SPAC Presentation Deck
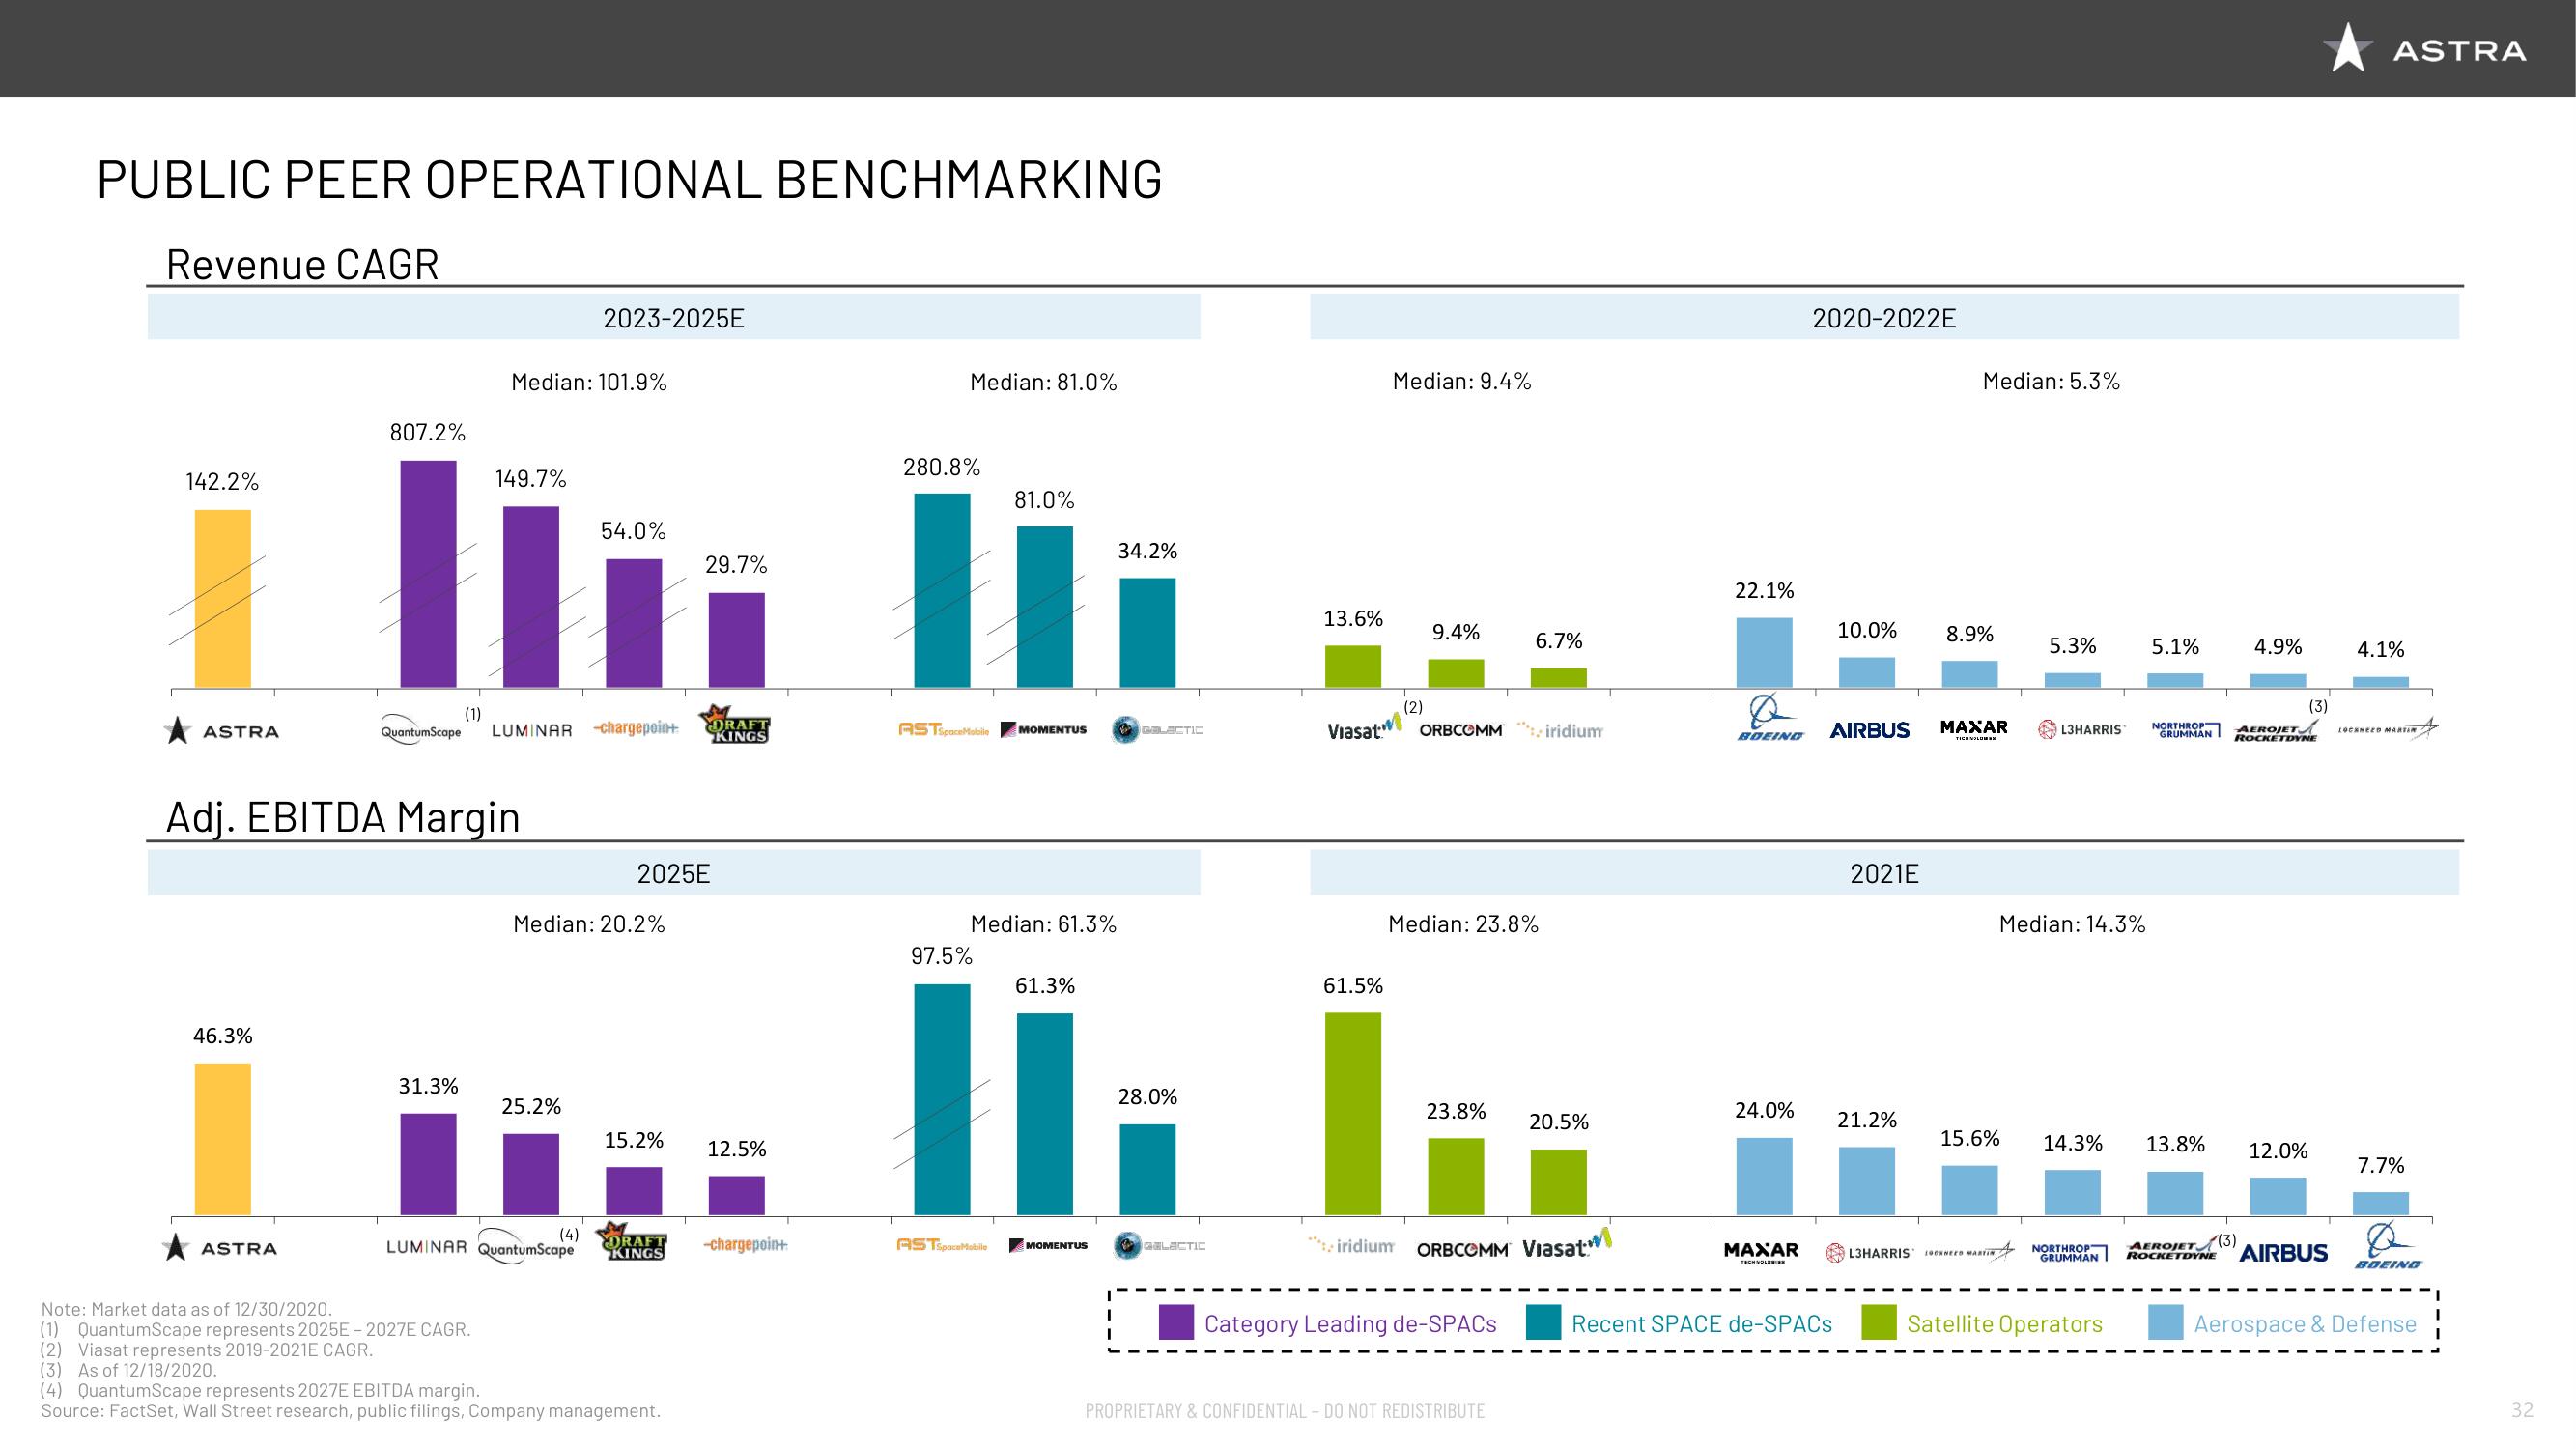
PUBLIC PEER OPERATIONAL BENCHMARKING
Revenue CAGR
142.2%
ASTRA
46.3%
807.2%
ASTRA
QuantumScape
(1)
31.3%
Adj. EBITDA Margin
Median: 101.9%
149.7%
Note: Market data as of 12/30/2020.
(1) QuantumScape represents 2025E-2027E CAGR.
(2) Viasat represents 2019-2021E CAGR.
(3) As of 12/18/2020.
LUMINAR -chargepoin+
2023-2025E
25.2%
(4)
LUMINAR QuantumScape
54.0%
Median: 20.2%
2025E
15.2%
DRAFT
KINGS
29.7%
(4) QuantumScape represents 2027E EBITDA margin.
Source: FactSet, Wall Street research, public filings, Company management.
DRAFT
KINGS
12.5%
-chargepoin+
Median: 81.0%
280.8%
ASTSpaceMobile
97.5%
81.0%
Median: 61.3%
ASTSpaceMobile
MOMENTUS
61.3%
MOMENTUS
I
I
34.2%
P
GALECTIC
28.0%
GELACTIC
13.6%
Viasat
61.5%
Median: 9.4%
(2)
" iridium
9.4%
ORBCOMM
Median: 23.8%
23.8%
6.7%
Category Leading de-SPACS
PROPRIETARY & CONFIDENTIAL - DO NOT REDISTRIBUTE
iridium
ORBCOMM Viasat.
20.5%
22.1%
BOEING
24.0%
MAXAR
TECHNOLO
2020-2022E
10.0%
AIRBUS
Recent SPACE de-SPACs
2021E
21.2%
L3HARRIS
Median: 5.3%
8.9%
MAXAR
15.6%
LOCKNEED MARTIN
5.3%
L3HARRIS
Median: 14.3%
14.3%
GRUMM
Satellite Operators
5.1%
NORTHROP
GRUMMAN
4.9%
AEROJET
ROCKETDYNE
13.8% 12.0%
AEROJET (3)
ROCKETDYNE
(3)
AIRBUS
ASTRA
4.1%
LOCKNEED MARTIN
7.7%
BOEING
Aerospace & Defense
32View entire presentation