IBEX Results Presentation Deck
ibex.
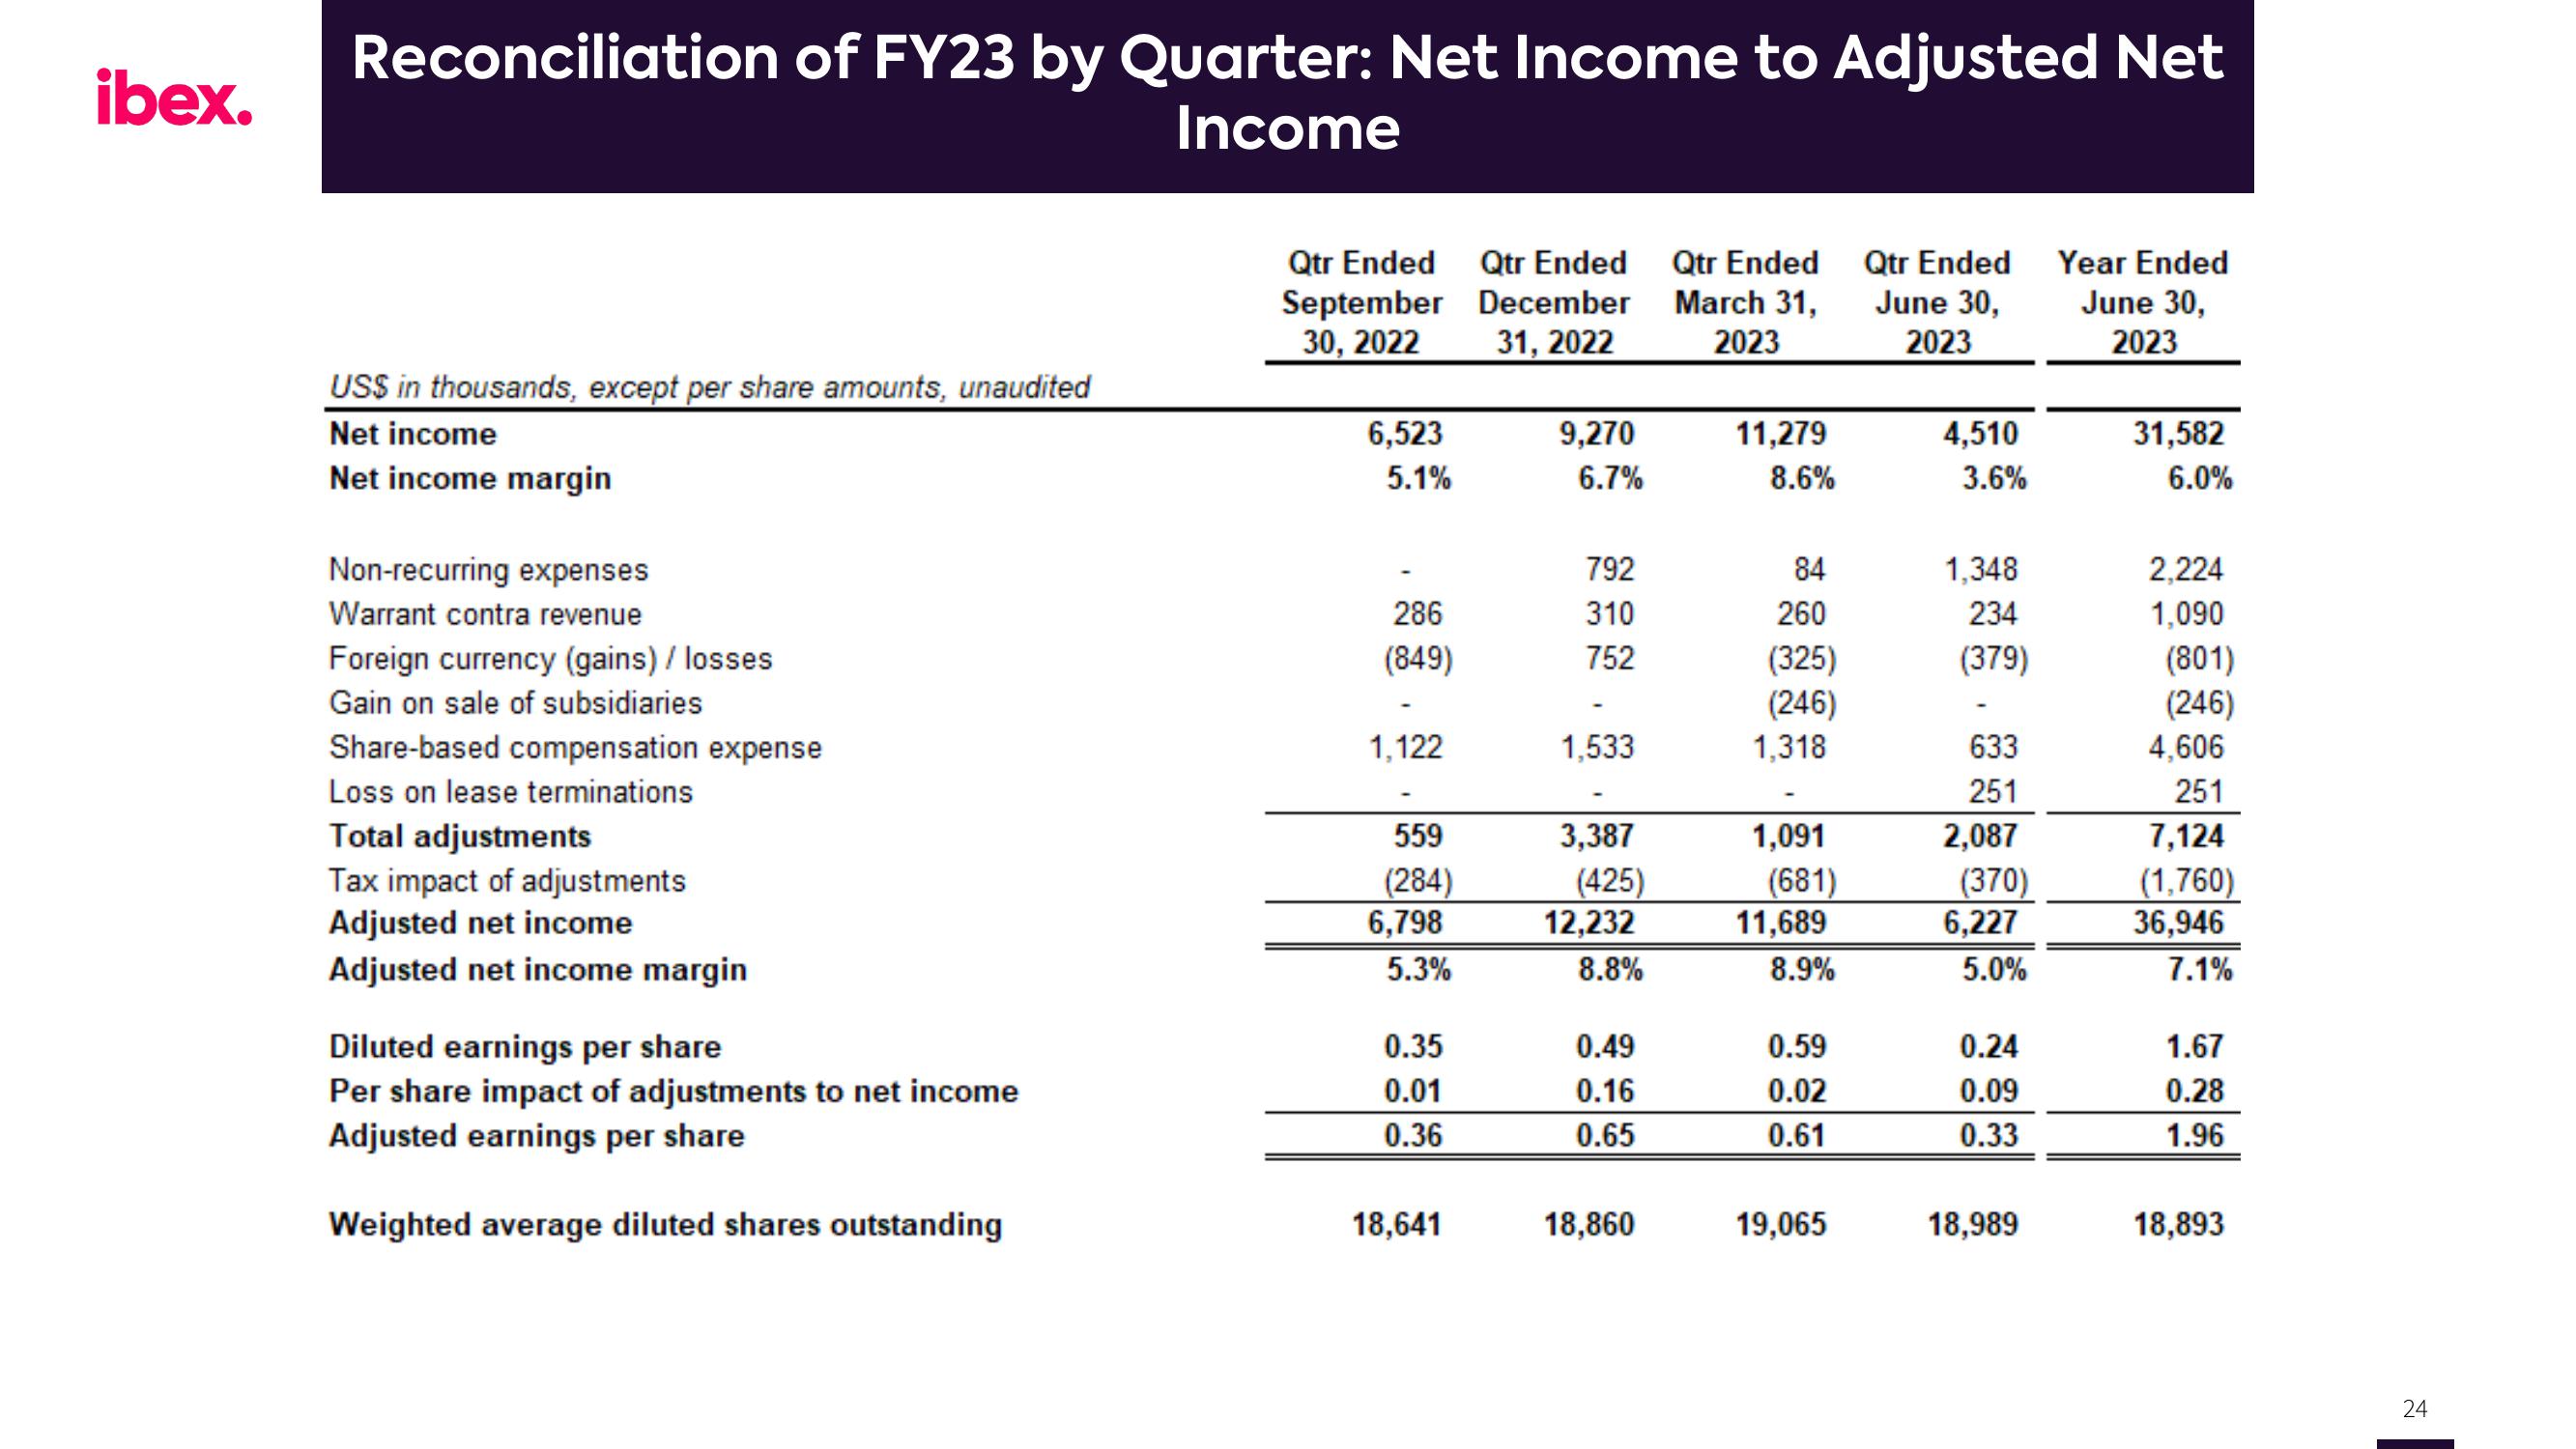
Reconciliation of FY23 by Quarter: Net Income to Adjusted Net
Income
US$ in thousands, except per share amounts, unaudited
Net income
Net income margin
Non-recurring expenses
Warrant contra revenue
Foreign currency (gains) / losses
Gain on sale of subsidiaries
Share-based compensation expense
Loss on lease terminations
Total adjustments
Tax impact of adjustments
Adjusted net income
Adjusted net income margin
Diluted earnings per share
Per share impact of adjustments to net income
Adjusted earnings per share
Weighted average diluted shares outstanding
Qtr Ended Qtr Ended
September December
30, 2022 31, 2022
6,523
5.1%
286
(849)
1,122
559
(284)
6,798
5.3%
0.35
0.01
0.36
18,641
9,270
6.7%
792
310
752
1,533
3,387
(425)
12,232
8.8%
0.49
0.16
0.65
18,860
Qtr Ended
March 31,
2023
11,279
8.6%
84
260
(325)
(246)
1,318
1,091
(681)
11,689
8.9%
0.59
0.02
0.61
19,065
Qtr Ended
June 30,
2023
4,510
3.6%
1,348
234
(379)
633
251
2,087
(370)
6,227
5.0%
0.24
0.09
0.33
18,989
Year Ended
June 30,
2023
31,582
6.0%
2,224
1,090
(801)
(246)
4,606
251
7,124
(1,760)
36,946
7.1%
1.67
0.28
1.96
18,893
24View entire presentation