Lyft Results Presentation Deck
Revenue per Active Rider
$45.06
Q1'20
$39.06 $39.94
Q2'20
Q3'20
($0.27)
$45.40 $45.13
Q4'20
Q1'21
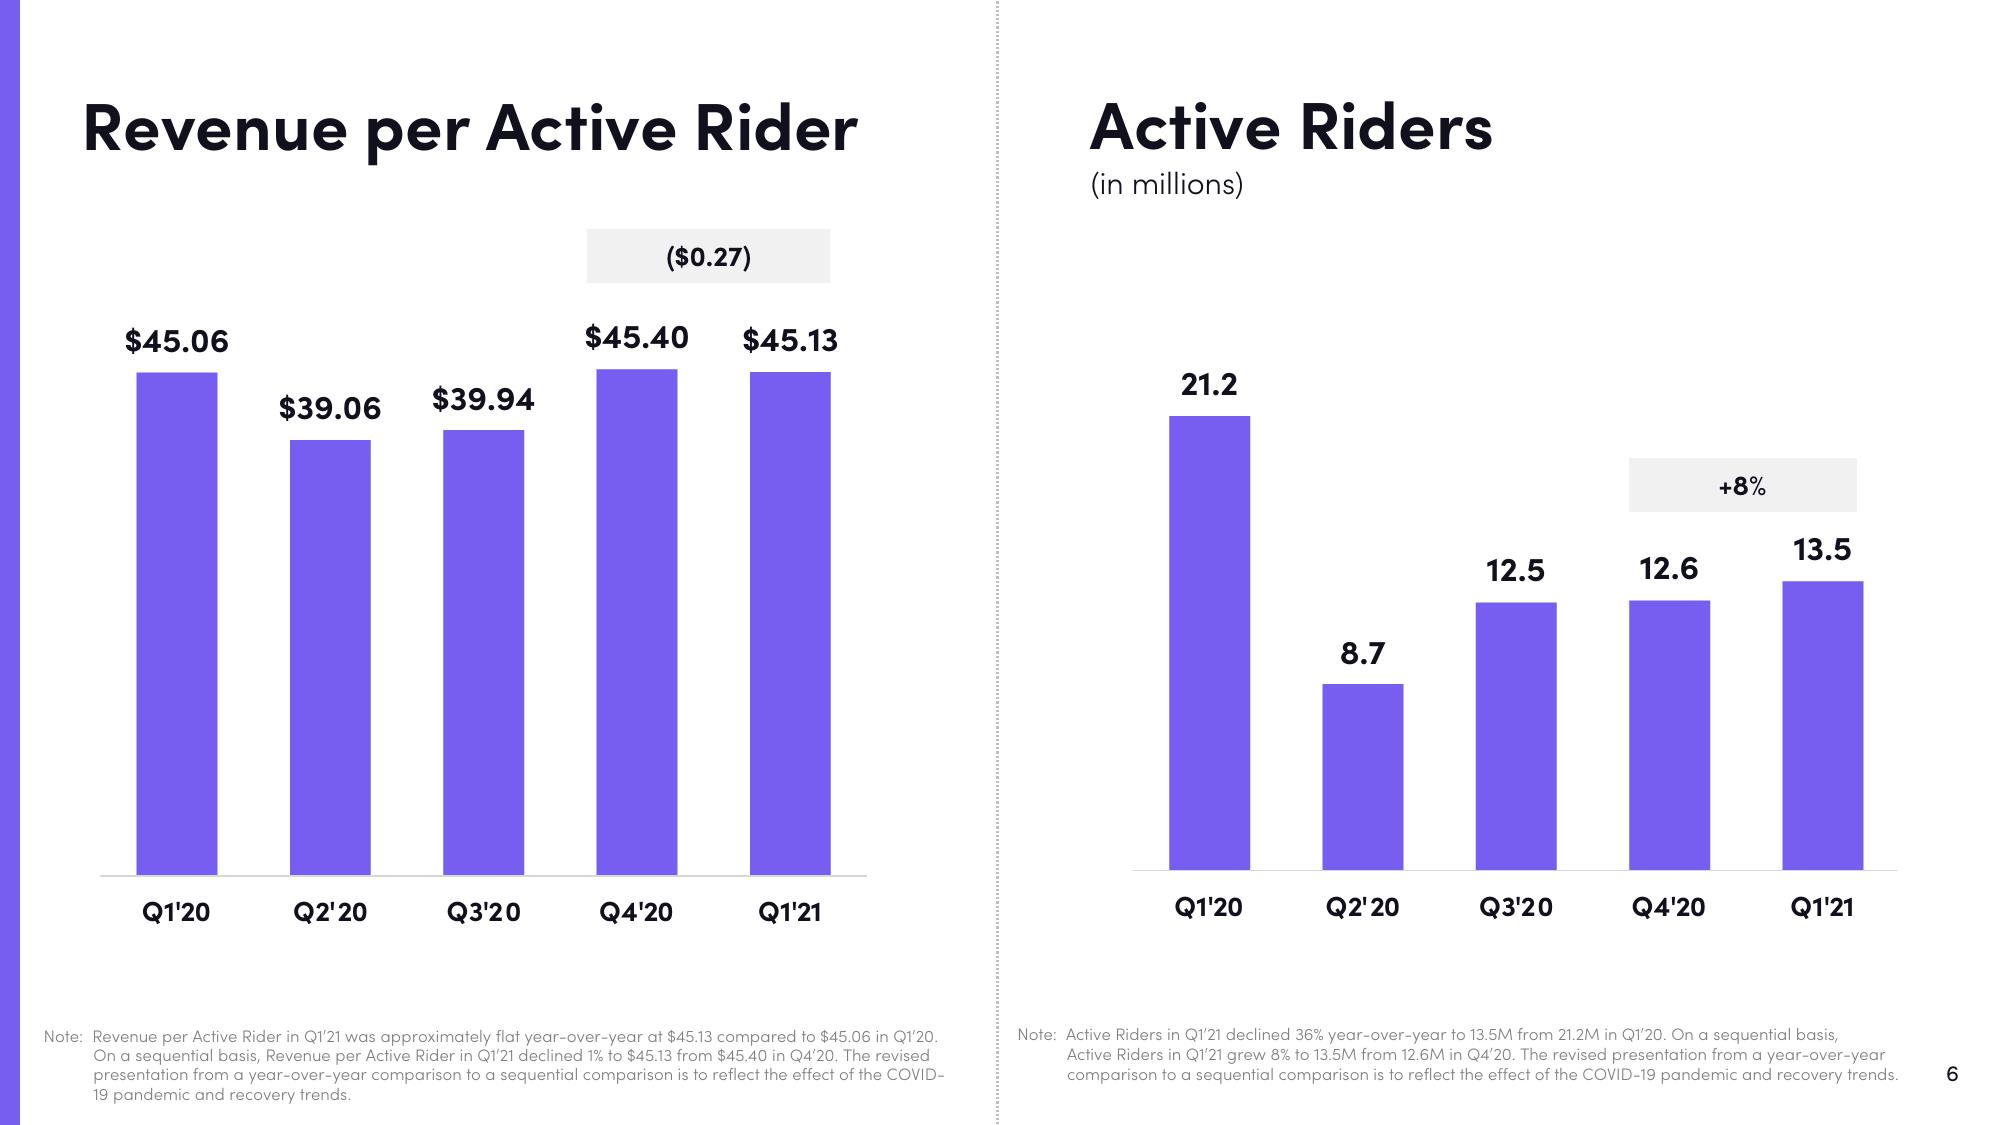
Note: Revenue per Active Rider in Q1'21 was approximately flat year-over-year at $45.13 compared to $45.06 in Q1'20.
On a sequential basis, Revenue per Active Rider in Q1'21 declined 1% to $45.13 from $45.40 in Q4'20. The revised
presentation from a year-over-year comparison to a sequential comparison is to reflect the effect of the COVID-
19 pandemic and recovery trends.
Active Riders
(in millions)
21.2
Q1'20
8.7
Q2'20
12.5
Q3'20
12.6
Q4'20
+8%
13.5
Q1'21
Note: Active Riders in Q1'21 declined 36% year-over-year to 13.5M from 21.2M in Q1'20. On a sequential basis,
Active Riders in Q1'21 grew 8% to 13.5M from 12.6M in Q4'20. The revised presentation from a year-over-year
comparison to a sequential comparison is to reflect the effect of the COVID-19 pandemic and recovery trends.
6View entire presentation