Investor Presentation
Our Strategy
Delivering superior value, while keeping a sound balance sheet and risk
profile
edp
Renewables
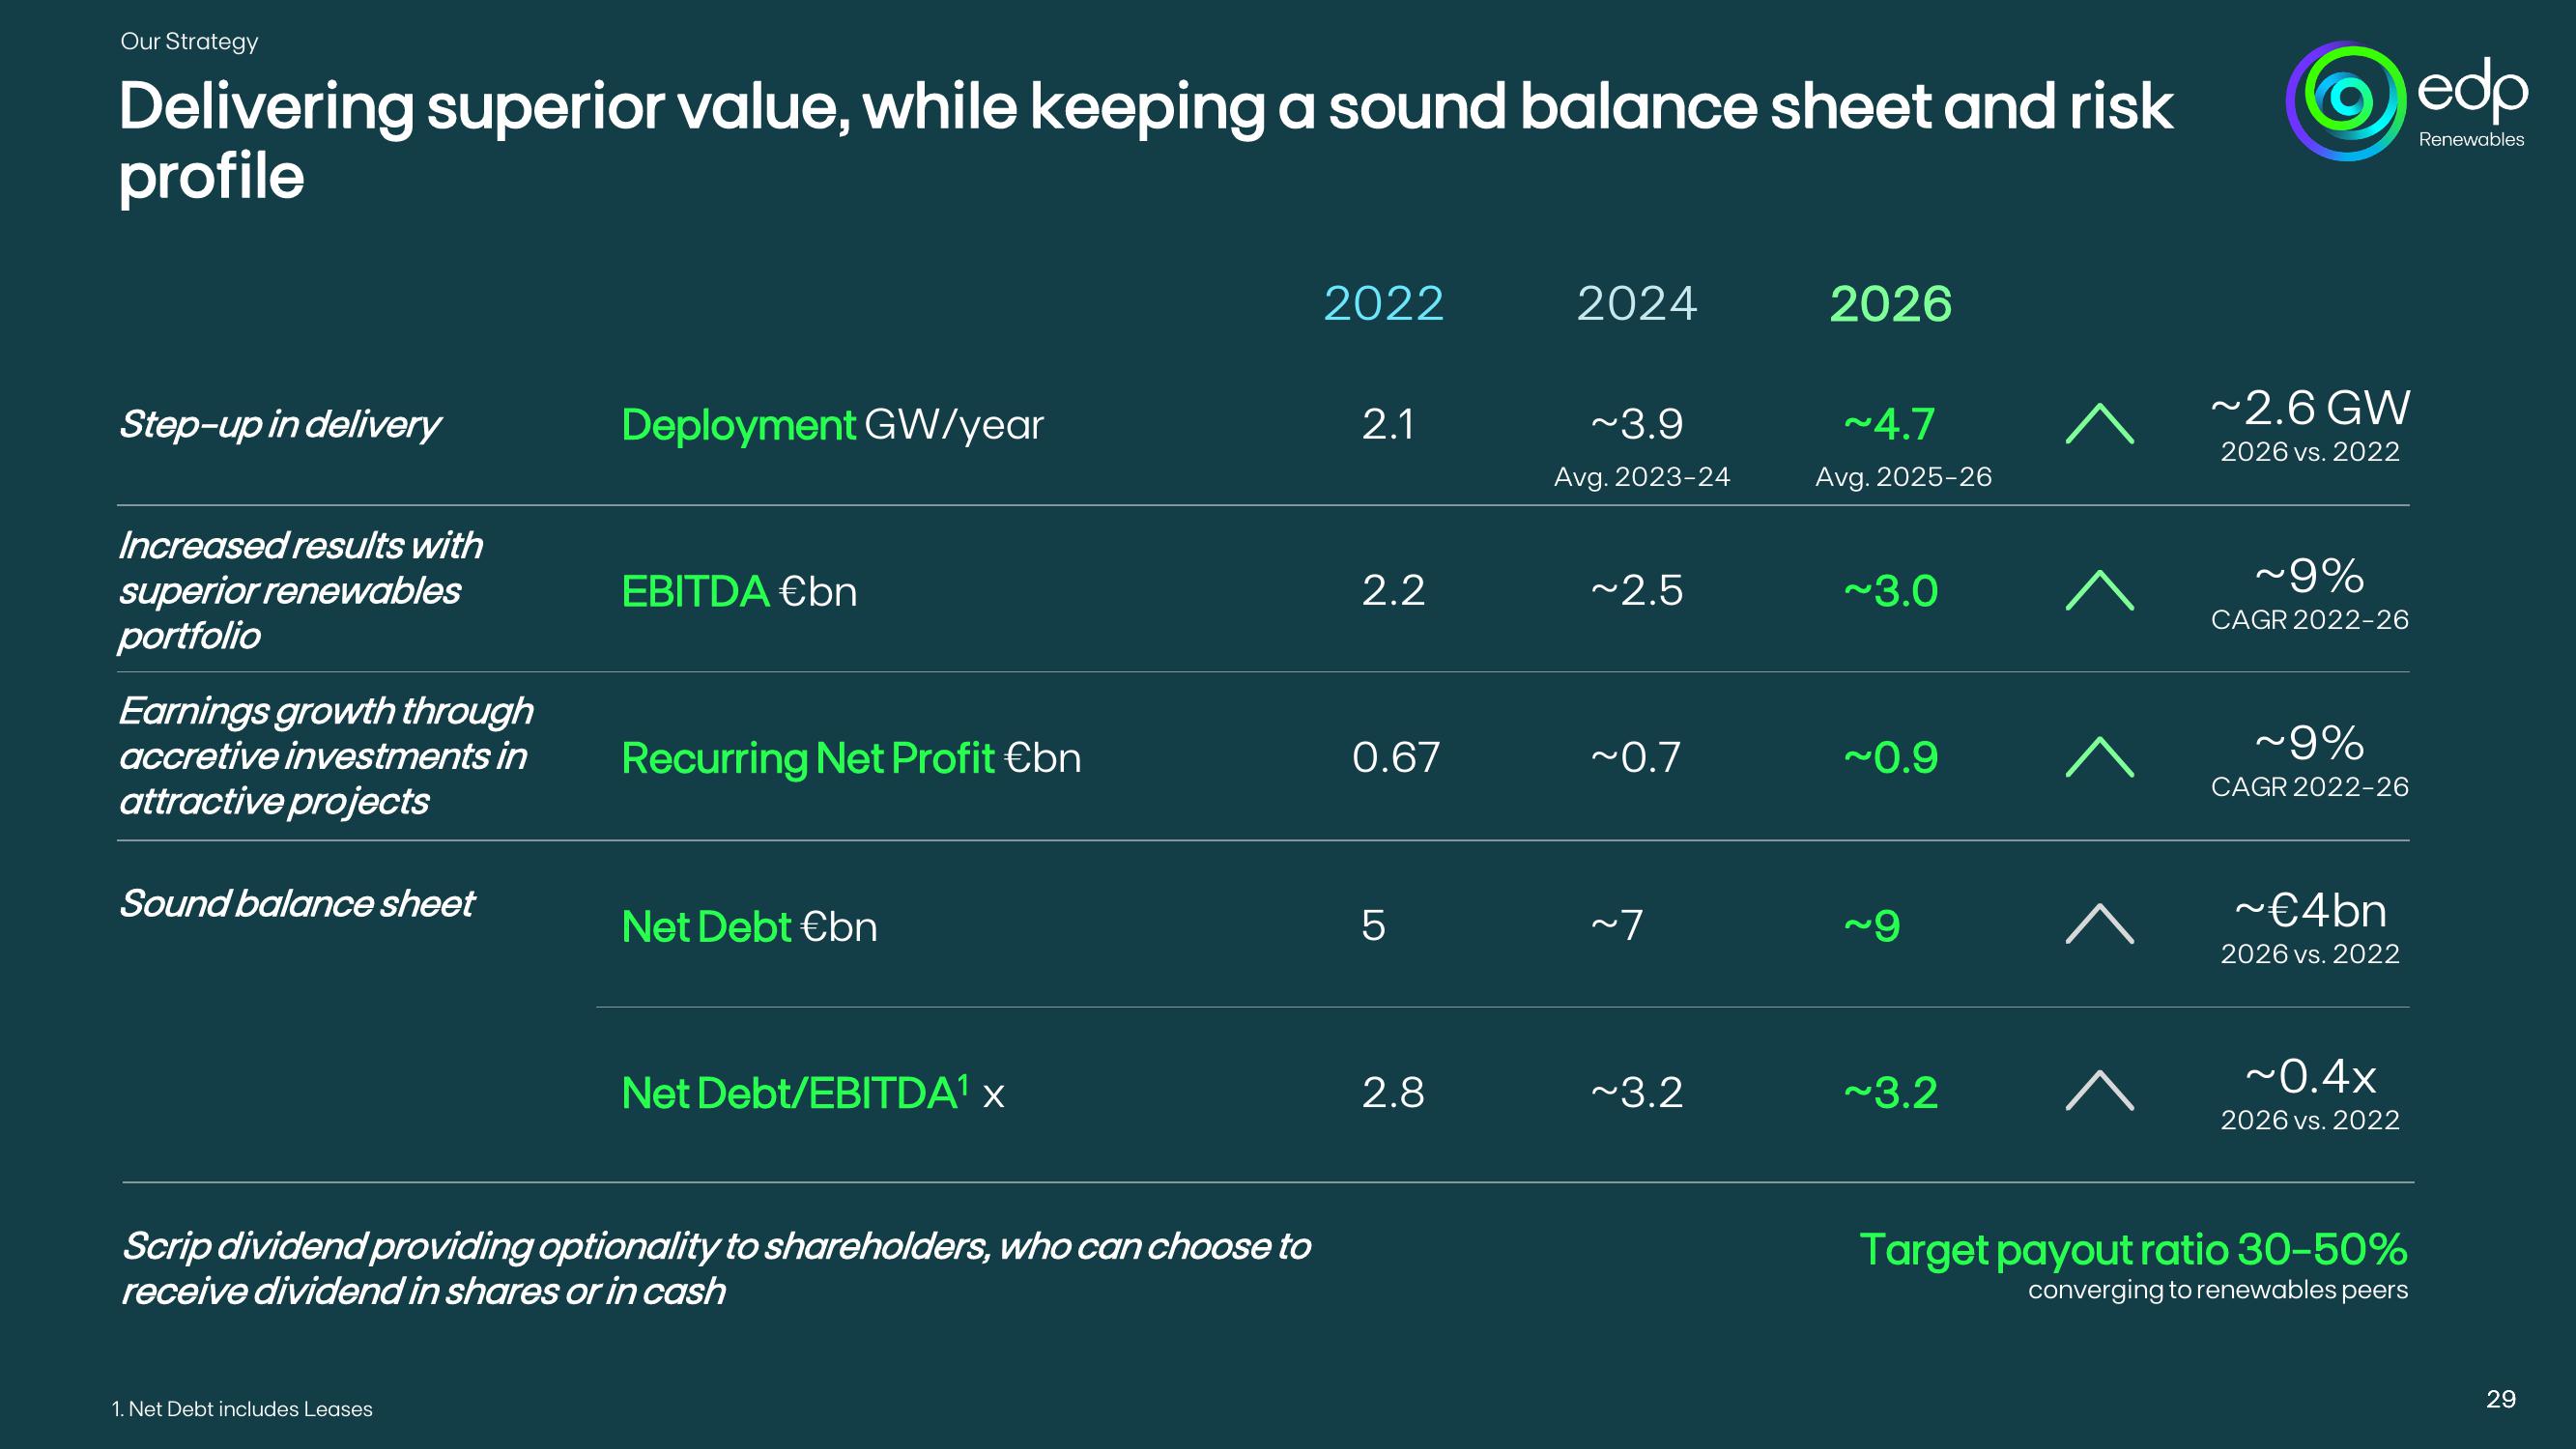
Step-up in delivery
2022
2024
2026
Deployment GW/year
2.1
~3.9
~4.7
Avg. 2023-24
Avg. 2025-26
Increased results with
superior renewables
portfolio
EBITDA €bn
2.2
~2.5
~3.0
^
Earnings growth through
accretive investments in
attractive projects
Recurring Net Profit €bn
0.67
~0.7
~0.9
Sound balance sheet
Net Debt €bn
LO
5
~7
~9
^
Net Debt/EBITDA1 x
Scrip dividend providing optionality to shareholders, who can choose to
receive dividend in shares or in cash
1. Net Debt includes Leases
2.8
~3.2
~3.2
^
~2.6 GW
2026 vs. 2022
~9%
CAGR 2022-26
~9%
CAGR 2022-26
~€4bn
2026 vs. 2022
~0.4x
2026 vs. 2022
Target payout ratio 30-50%
converging to renewables peers
29View entire presentation