Fastly Investor Presentation Deck
fastly. Momentum-at-a-Glance
At IPO (May 2019)
Revenue
%
Average Revenue Across All
Enterprise Customers*
Dollar Based Net
Expansion Rate**
Revenue from Enterprise
Customers as a % of Total
Revenue
Annual Revenue
Retention Rate***
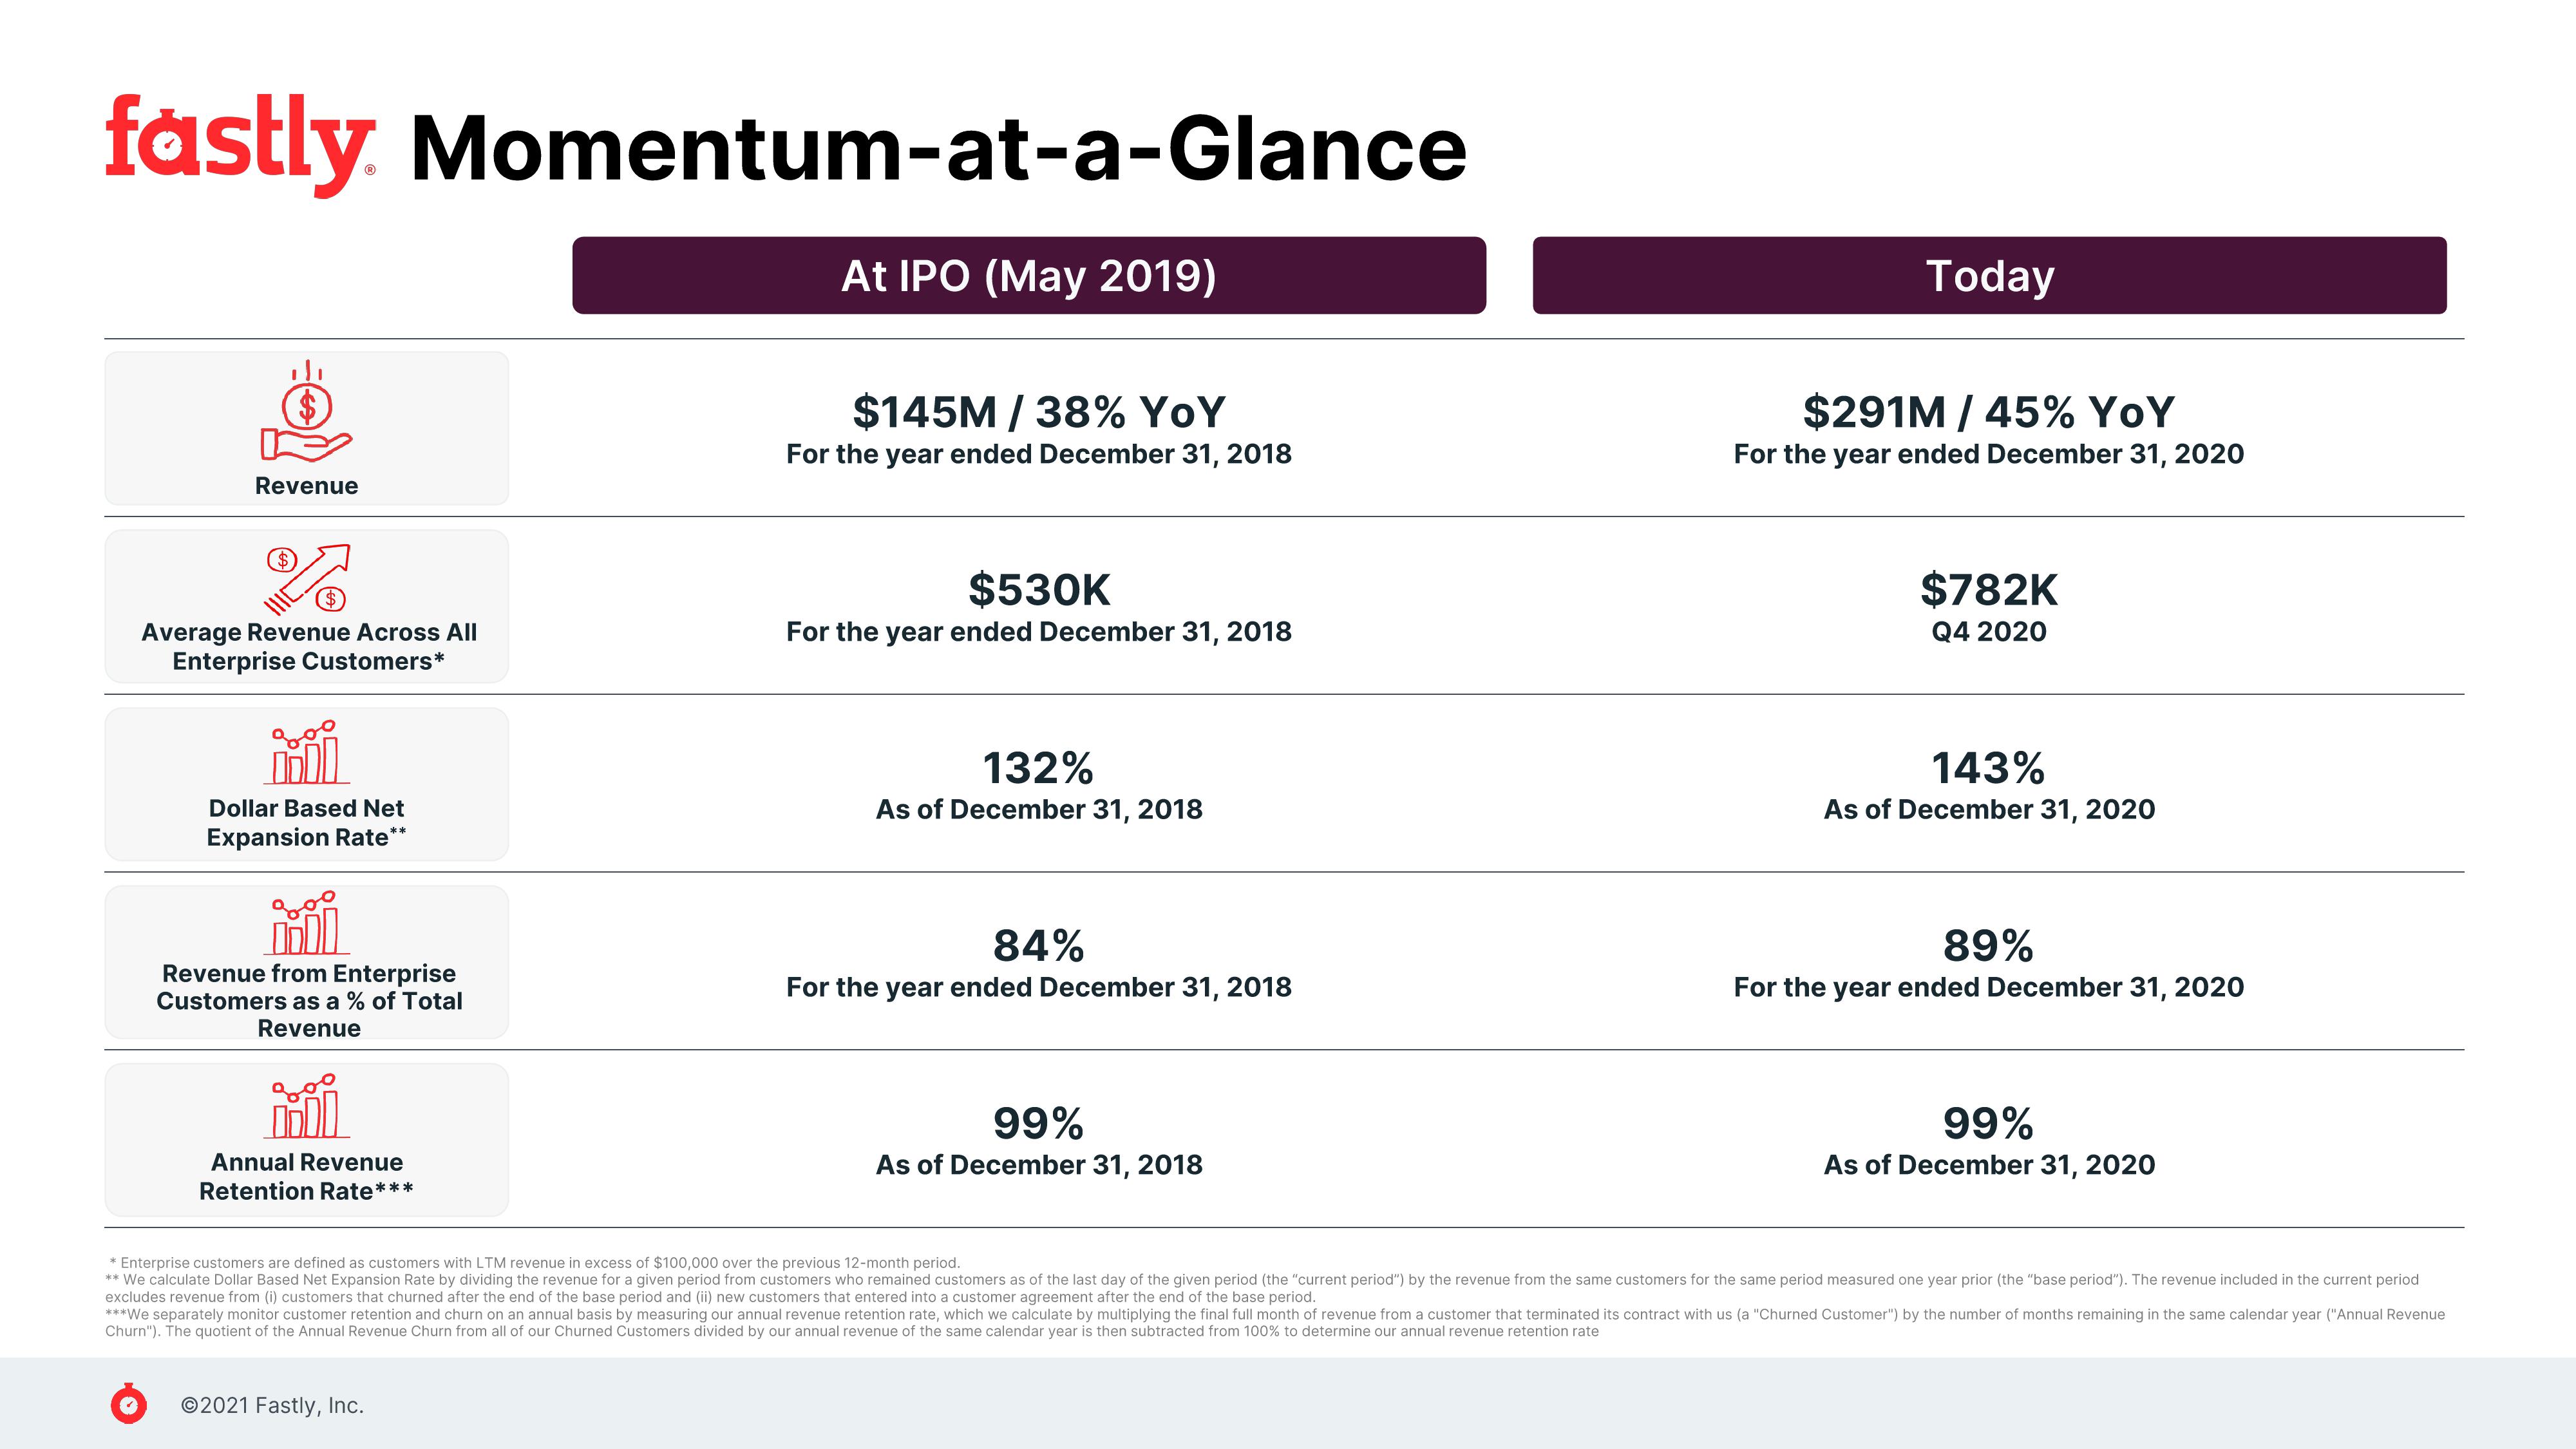
$145M/38% YoY
For the year ended December 31, 2018
Ⓒ2021 Fastly, Inc.
$530K
For the year ended December 31, 2018
132%
As of December 31, 2018
84%
For the year ended December 31, 2018
99%
As of December 31, 2018
Today
$291M / 45% YoY
For the year ended December 31, 2020
$782K
Q4 2020
143%
As of December 31, 2020
89%
For the year ended December 31, 2020
99%
As of December 31, 2020
* Enterprise customers are defined as customers with LTM revenue in excess of $100,000 over the previous 12-month period.
** We calculate Dollar Based Net Expansion Rate by dividing the revenue for a given period from customers who remained customers as of the last day of the given period (the "current period") by the revenue from the same customers for the same period measured one year prior (the "base period"). The revenue included in the current period
excludes revenue from (i) customers that churned after the end of the base period and (ii) new customers that entered into a customer agreement after the end of the base period.
***We separately monitor customer retention and churn on an annual basis by measuring our annual revenue retention rate, which we calculate by multiplying the final full month of revenue from a customer that terminated its contract with us (a "Churned Customer") by the number of months remaining in the same calendar year ("Annual Revenue
Churn"). The quotient of the Annual Revenue Churn from all of our Churned Customers divided by our annual revenue of the same calendar year is then subtracted from 100% to determine our annual revenue retention rateView entire presentation