KKR Real Estate Finance Trust Results Presentation Deck
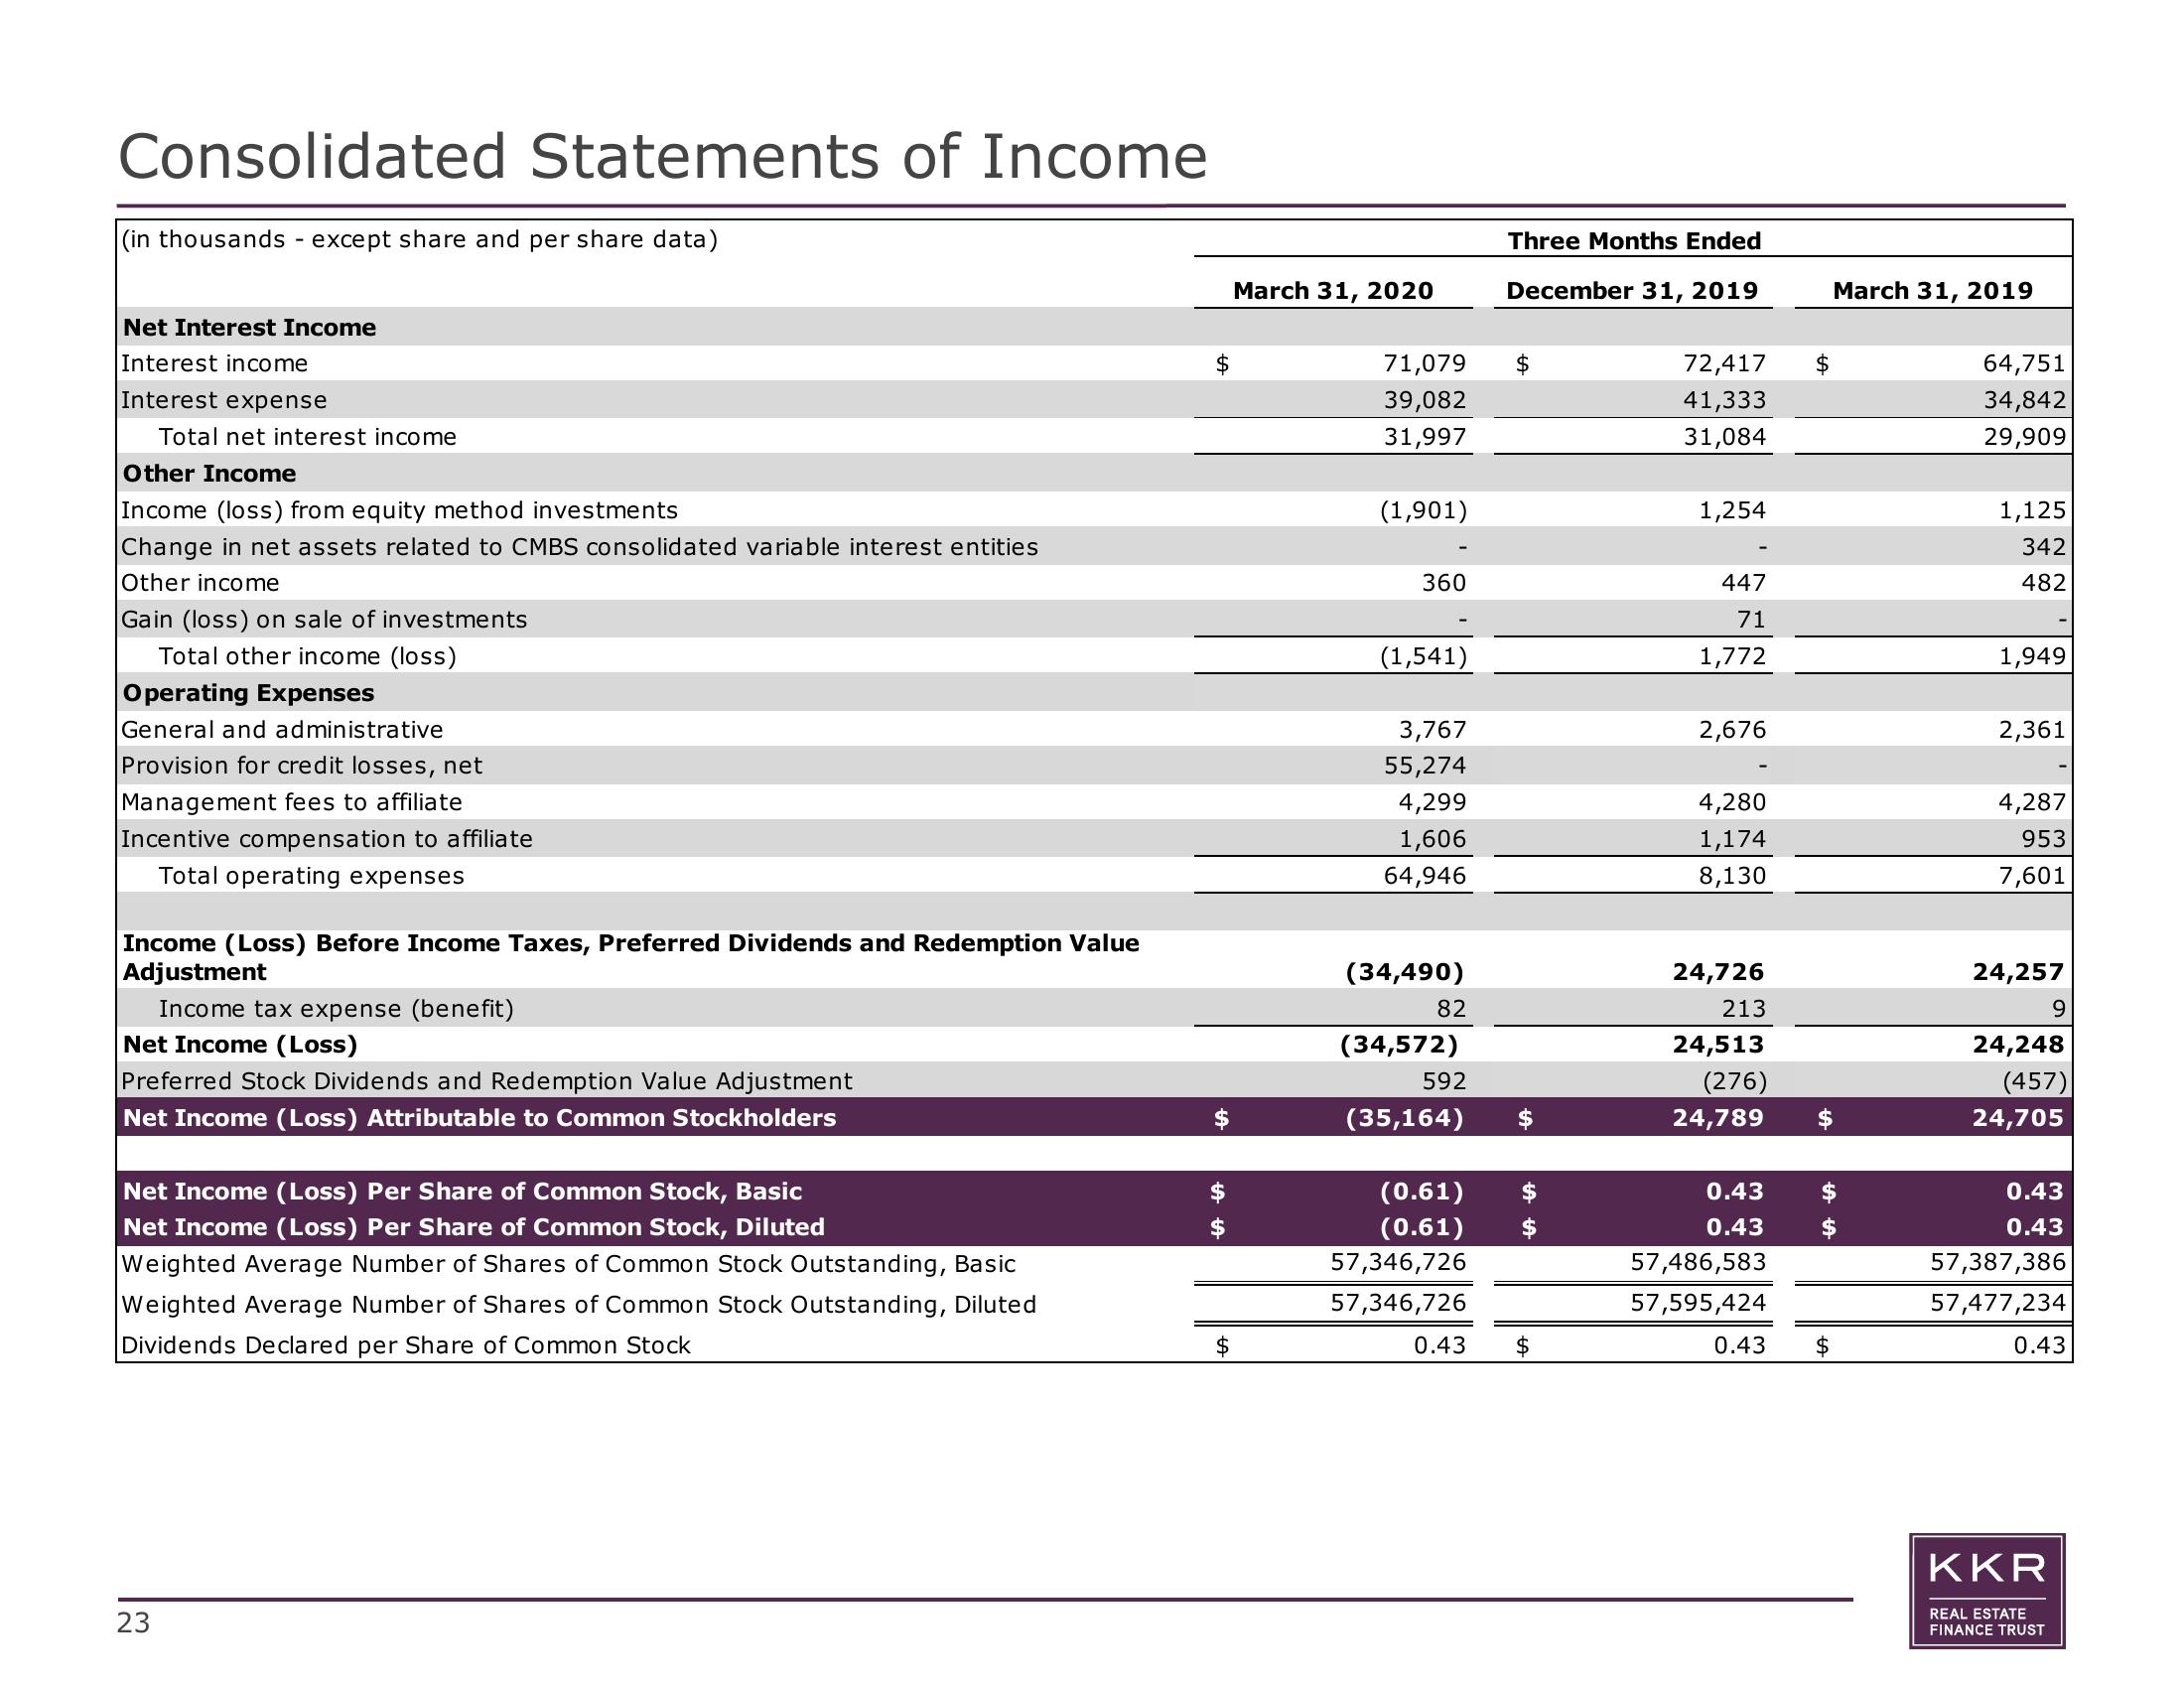
Consolidated Statements of Income
(in thousands - except share and per share data)
Net Interest Income
Interest income
Interest expense
Total net interest income
Other Income
Income (loss) from equity method investments
Change in net assets related to CMBS consolidated variable interest entities
Other income
Gain (loss) on sale of investments
Total other income (loss)
Operating Expenses
General and administrative
Provision for credit losses, net
Management fees to affiliate
Incentive compensation to affiliate
Total operating expenses
Income (Loss) Before Income Taxes, Preferred Dividends and Redemption Value
Adjustment
Income tax expense (benefit)
Net Income (Loss)
Preferred Stock Dividends and Redemption Value Adjustment
Net Income (Loss) Attributable to Common Stockholders
Net Income (Loss) Per Share of Common Stock, Basic
Net Income (Loss) Per Share of Common Stock, Diluted
Weighted Average Number of Shares of Common Stock Outstanding, Basic
Weighted Average Number of Shares of Common Stock Outstanding, Diluted
Dividends Declared per Share of Common Stock
23
SASA
March 31, 2020
71,079
39,082
31,997
(1,901)
360
(1,541)
3,767
55,274
4,299
1,606
64,946
(34,490)
82
(34,572)
592
(35,164)
(0.61)
(0.61)
57,346,726
57,346,726
0.43
Three Months Ended
December 31, 2019
$
SASA
$
72,417
41,333
31,084
1,254
447
71
1,772
2,676
4,280
1,174
8,130
24,726
213
24,513
(276)
24,789
0.43
0.43
57,486,583
57,595,424
$
0.43 $
March 31, 2019
64,751
34,842
29,909
1,125
342
482
1,949
2,361
4,287
953
7,601
24,257
9
24,248
(457)
24,705
0.43
0.43
57,387,386
57,477,234
0.43
KKR
REAL ESTATE
FINANCE TRUSTView entire presentation