Evercore Investment Banking Pitch Book
SIRE Situation Analysis
Historical and Projected Margin per Ton Analysis
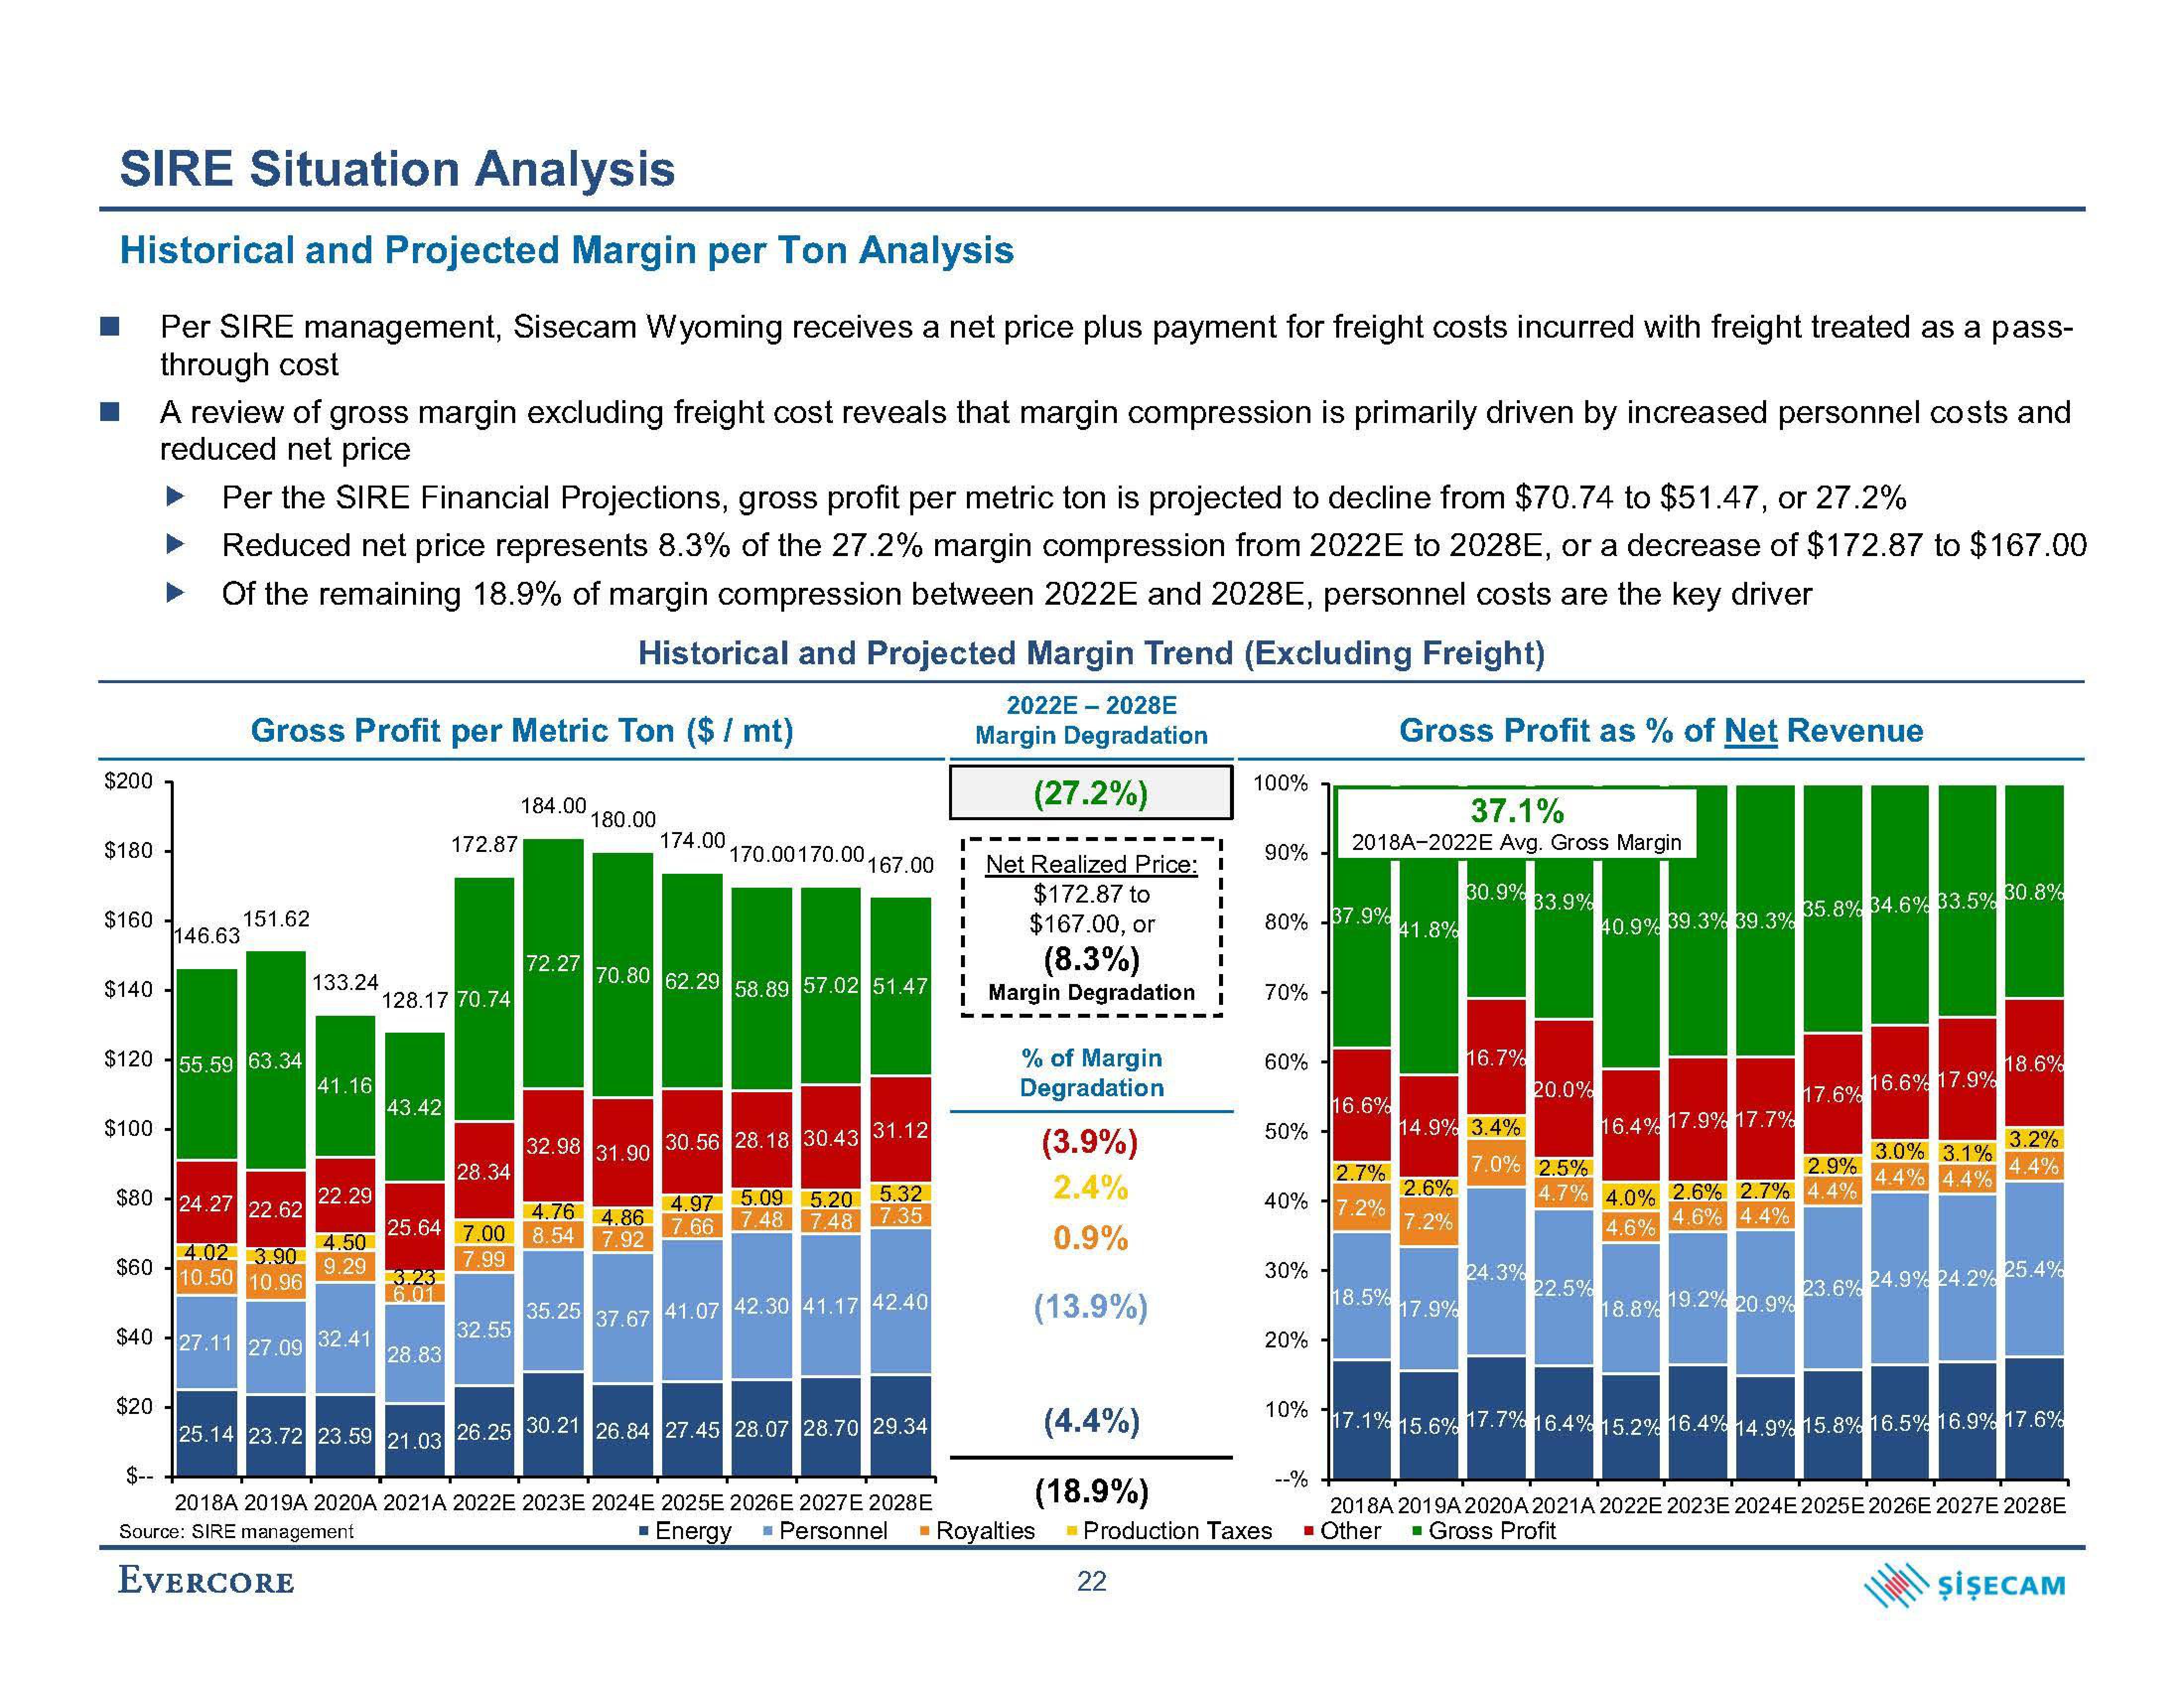
Per SIRE management, Sisecam Wyoming receives a net price plus payment for freight costs incurred with freight treated as a pass-
through cost
$200
$180
$160
$140
$100
$80
A review of gross margin excluding freight cost reveals that margin compression is primarily driven by increased personnel costs and
reduced net price
Per the SIRE Financial Projections, gross profit per metric ton is projected to decline from $70.74 to $51.47, or 27.2%
Reduced net price represents 8.3% of the 27.2% margin compression from 2022E to 2028E, or a decrease of $172.87 to $167.00
Of the remaining 18.9% of margin compression between 2022E and 2028E, personnel costs are the key driver
Historical and Projected Margin Trend (Excluding Freight)
2022E-2028E
Margin Degradation
(27.2%)
146.63
$12055.59 63.34
$60
Gross Profit per Metric Ton ($ / mt)
151.62
$20-
133.24
24.27 22.62
4.02 3.90
10.50 10.96
$40 27.11 27.09 32.41
41.16
22.29
4.50
9.29
128.17 70.74
43.42
25.64
3.23
6.01
28.83
172.87
25.14 23.72 23.59 21.03
28.34
184.00
32.55
72.27
180.00
32.98 31.90
4.76 4.86
7.00 8.54 7.92
7.99
35.25
174.00
70.80 62.29 58.89 57.02 51.47
37.67
170.00 170.00.
167.00
30.56 28.18 30.43 31.12
5.09 5.20 5.32
4.97
7.66
7.48 7.48 7.35
41.07 42.30 41.17 42.40
26.25 30.21 26.84 27.45 28.07 28.70 29.34
2018A 2019A 2020A 2021A 2022E 2023E 2024E 2025E 2026E 2027E 2028E
Source: SIRE management
EVERCORE
I
Net Realized Price:
$172.87 to
$167.00, or
(8.3%)
Margin Degradation
% of Margin
Degradation
(3.9%)
2.4%
0.9%
(13.9%)
(4.4%)
(18.9%)
▪ Energy ■ Personnel ■ Royalties
I
22
100%
90%
80% -37.9%
70%-
60% -
50% -
30%
2.7%
40% 17.2%
20%
10%
Production Taxes
37.1%
2018A-2022E Avg. Gross Margin
--%
16.6%
Gross Profit as % of Net Revenue
141.8%
18.5%
2.6%
7.2%
14.9% 3.4%
17.9%
30.9%
17.1% 15.6%
16.7%
33.9%
24.3%
20.0%
40.9% 39.3% 39.3%
22.5%
16.4% 17.9% 17.7%
7.0% 2.5%
4.7% 4.0% 2.6% 2.7% 4.4%
4.6%
4.6% 4.4%
18.8%
35.8% 34.6% 33.5% 30.8%
19.2% 20.9%
17.6% 16.6% 17.9%
3.0% 3.1%
2.9% 4.4% 4.4%
18.6%
3.2%
4.4%
23.6% 24.9% 24.2% 25.4%
17.7% 16.4% 15.2 % 16.4% 14.9% 15.8% 16.5% 16.9% 17.6%
2018A 2019A 2020A 2021A 2022E 2023E 2024E 2025E 2026E 2027E 2028E
■ Other ■ Gross Profit
ŞİŞECAMView entire presentation