Evercore Investment Banking Pitch Book
Appendix
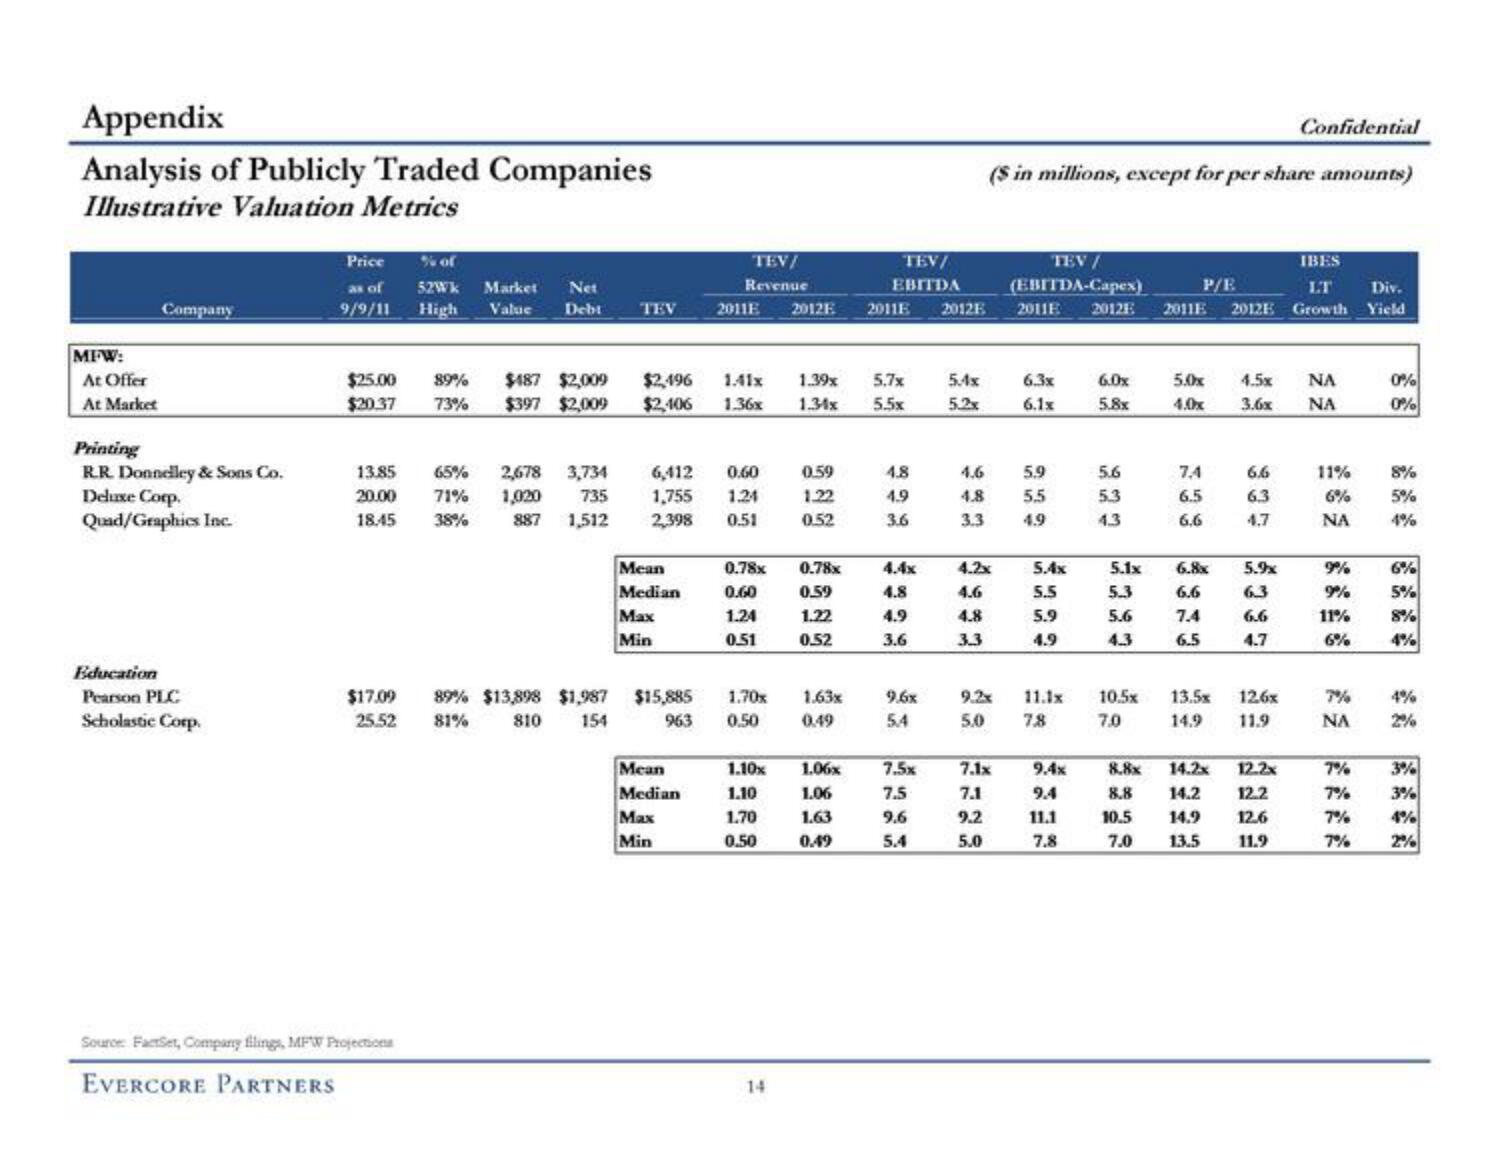
Analysis of Publicly Traded Companies
Illustrative Valuation Metrics
MFW:
At Offer
At Market
Company
Printing
R.R. Donnelley & Sons Co.
Deluxe Corp.
Quad/Graphics Inc.
Education
Pearson PLC
Scholastic Corp.
Price
% of
as of 52Wk Market Net
9/9/11 High
Value Debt
$25.00
$20.37
13.85
20.00
18.45
$17.09
25.52
Source FactSet, Company filings, MFW Projections
EVERCORE PARTNERS
89% $487 $2,009
73% $397 $2,009
65% 2,678 3,734
71% 1,020
735
887 1,512
38%
TEV
$2,496 1.41x
$2,406 1.36x
Mean
Median
Max
Min
TEV/
Revenue
6,412 0.60
1,755 1.24
2,398 0.51
89% $13,898 $1,987 $15,885
81%
810
154
963
Mean
Median
Max
Min
2011E 2012E 2011E 2012E
0.78x
0.60
1.24
0.51
1.70x
0.50
14
1.39x 5.7x
1.34x 5.5x
0.59
1.22
0.52
0.78x
0.59
1.22
0.52
TEV/
EBITDA
1.63x
0.49
1.10x 1.06x
1.10
1.06
1.70
1.63
0.50
0.49
4.8
4.9
3.6
4.4x
4.8
4.9
3.6
9.6x
5.4
7.5x
7.5
9.6
5.4
5.4x
5.2x
4.6
4.8
3.3
Confidential
($ in millions, except for per share amounts)
4.2x
4.6
4.8
3.3
9.2x
5.0
7.1x
7.1
9.2
5.0
TEV /
(EBITDA-Capex)
2011E 2012E
6.3x
6.1x
5.9
5.5
4.9
5.4x
5.5
5.9
4.9
11.1x
7.8
9.4x
9.4
11.1
7.8
6.0x
5.8x
5.6
5.3
4.3
5.1x
5.3
5.6
4.3
195.
7.0
IBES
LT Div.
2011E 2012E Growth Yield
P/E
5.0x 4.5x NA
4.0x 3.6x ΝΑ
7.4
6.5
6.6
6.8x
6.6
7.4
6.5
6.6
6.3
4.7
8.8x
14.2x
8.8
14.2
10.5
14.9
7.0 13.5
5.9x
6.3
6.6
4.7
135
126x
14.9 11.9
12.2x
12.2
12.6
11.9
11%
6%
ΝΑ
9%
9%
11%
6%
7%
NA
7%
7%
7%
7%
0%
0%
8%
5%
4%
6%
5%
8%
4%
3%
3%
4%
2%View entire presentation