Embracer Group Results Presentation Deck
FINANCIAL PERFORMANCE Q4
Cash flow and investments
SEK million
Adjusted EBITDA
Cash Tax
Other items
Operating Cash flow
Net investment in intangible assets
Net investment in tangible assets
Net investment in financial assets
Net Investment
Free Cash Flow before WC
Change in working capital
Free Cash Flow after WC
Cash Flow from financing activities
Net investment in acquired companies
Cash Flow for the period
Source: as of 31 March, 2023
FY22/23
Q4
1,938
-158
-251
1,529
-1,807
-178
62
-1,923
-395
363
-32
-877
-652
-1,561
FY21/22
Q4
1,527
-86
349
1,790
-998
-100
-62
-1,160
630
42
672
18,014
-27,914
-9,228
TTM
Q4
9,867
-902
-288
8,677
-5,996
-497
-61
-6,554
2,123
-2,162
-39
8,501
-10,067
-1,605
EMBRACER+
GROUP
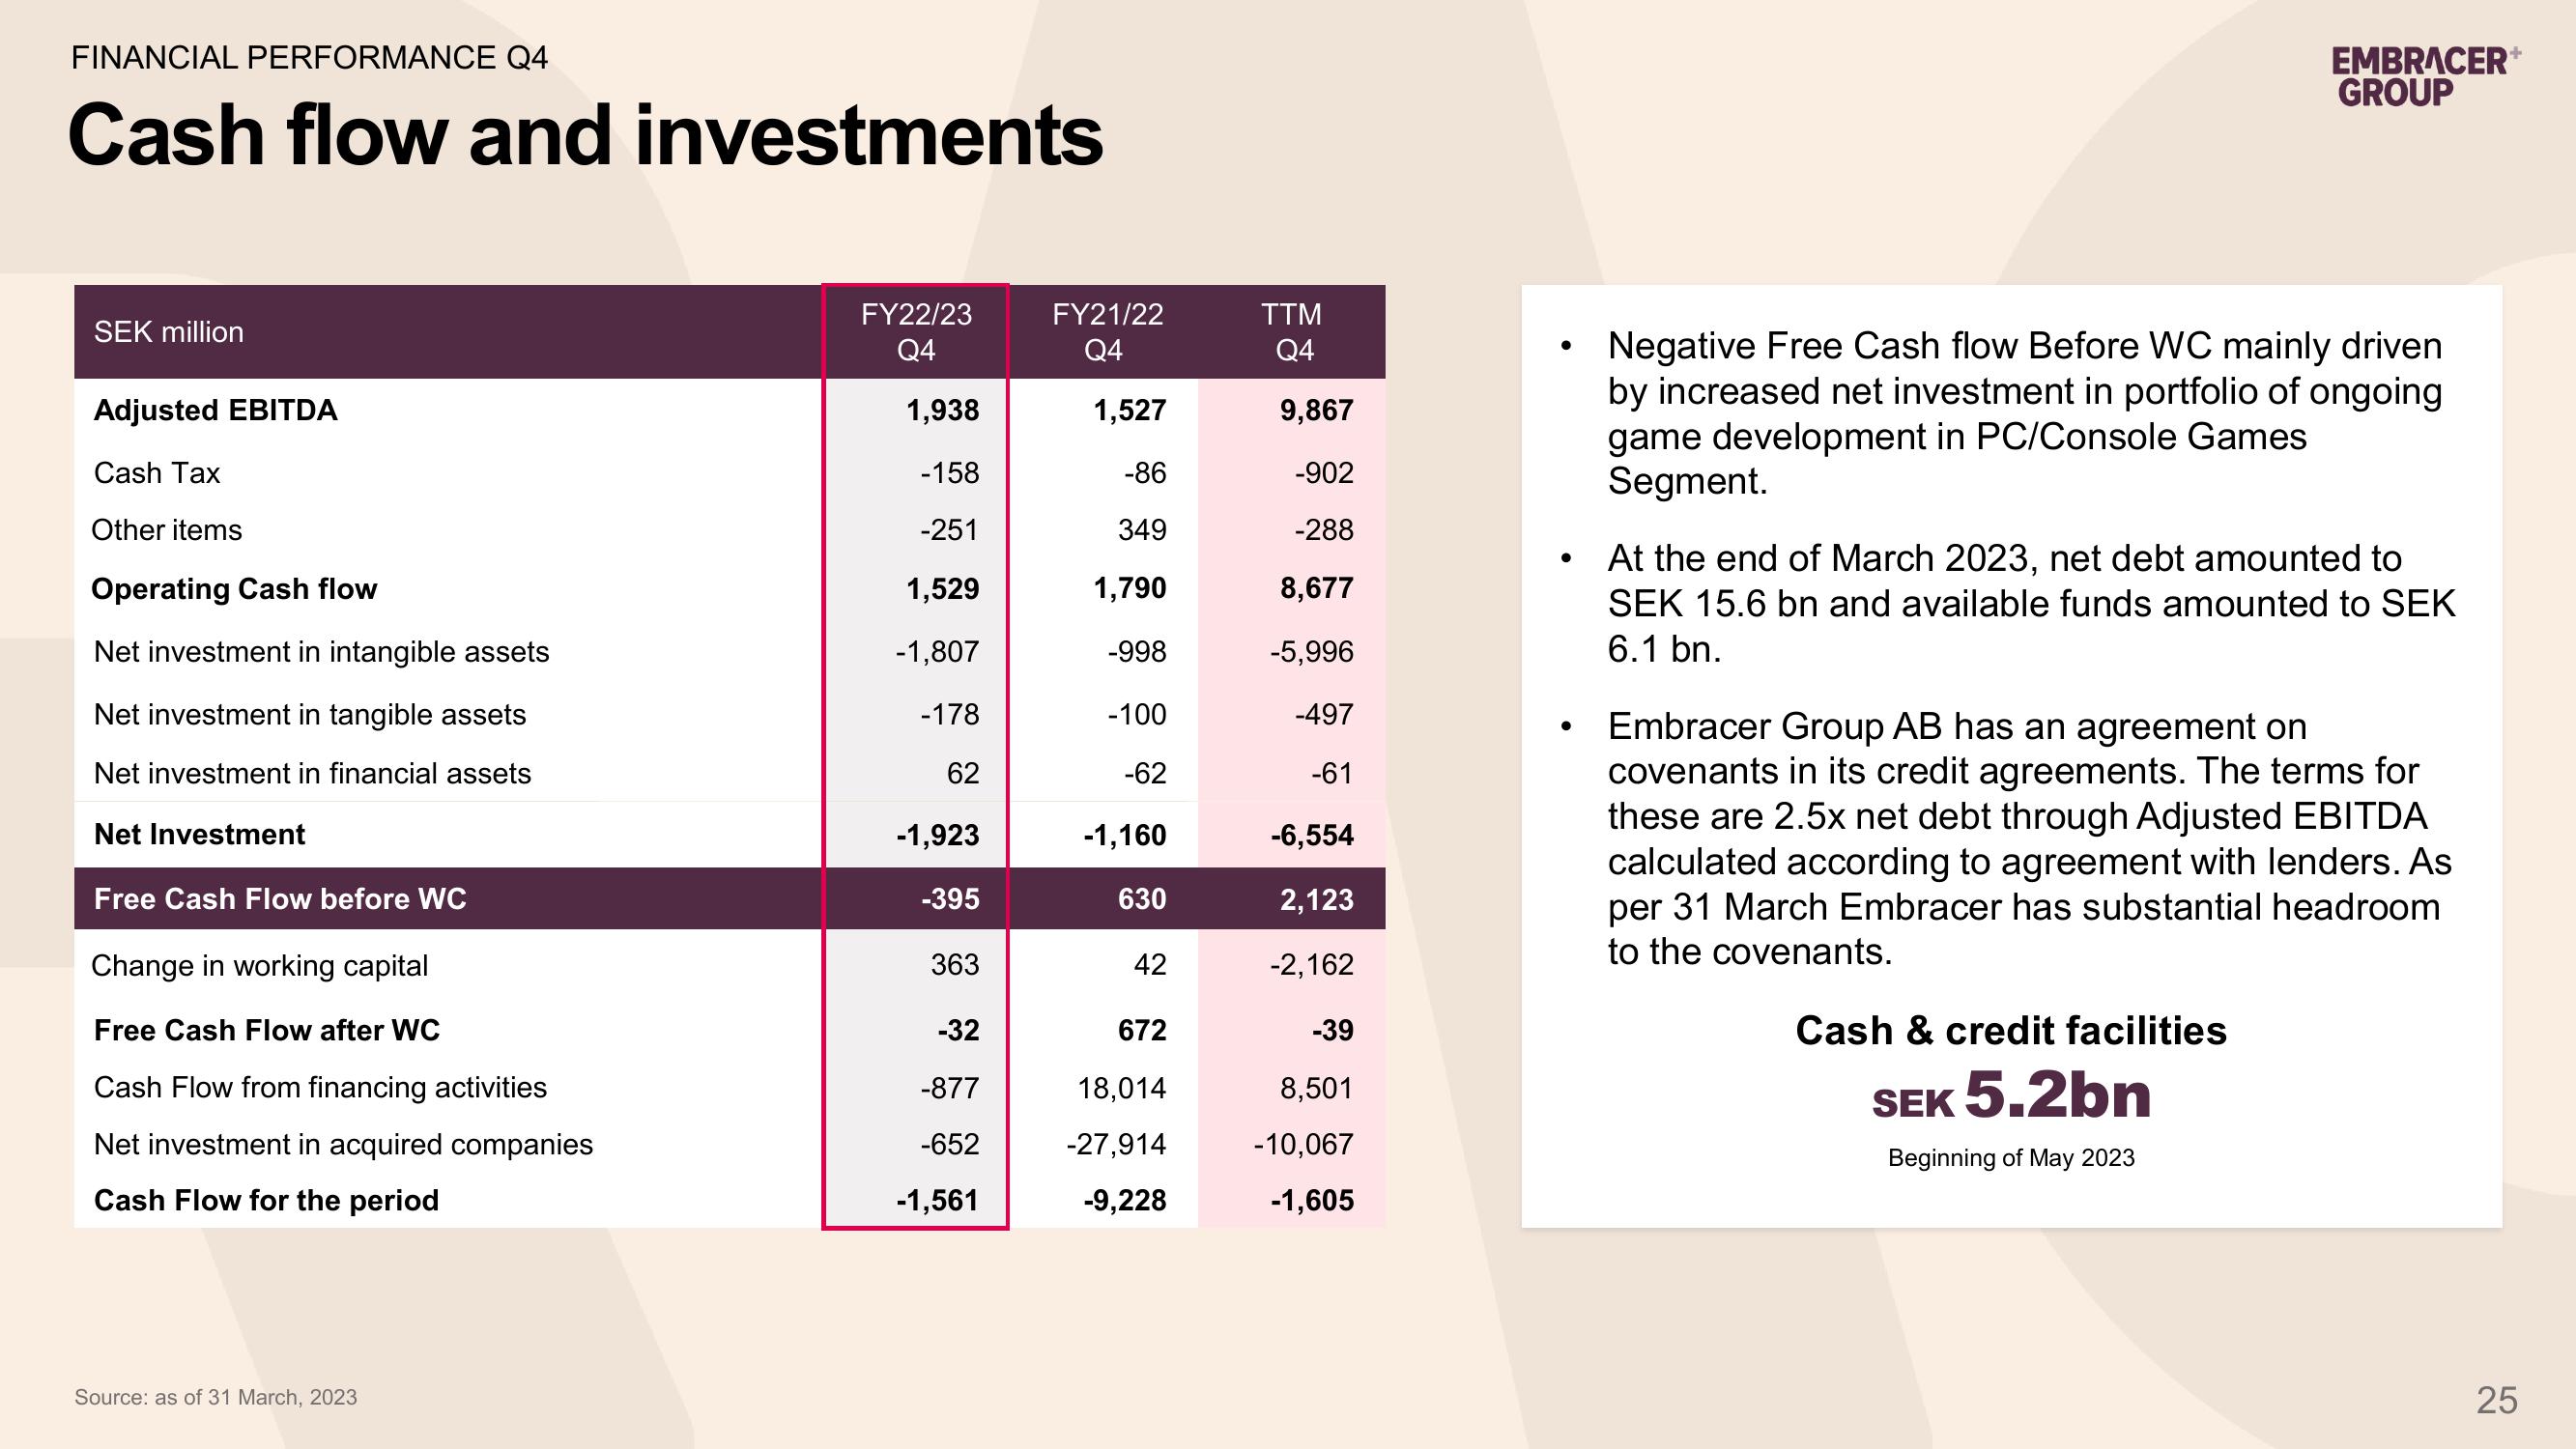
Negative Free Cash flow Before WC mainly driven
by increased net investment in portfolio of ongoing
game development in PC/Console Games
Segment.
At the end of March 2023, net debt amounted to
SEK 15.6 bn and available funds amounted to SEK
6.1 bn.
Embracer Group AB has an agreement on
covenants in its credit agreements. The terms for
these are 2.5x net debt through Adjusted EBITDA
calculated according to agreement with lenders. As
per 31 March Embracer has substantial headroom
to the covenants.
Cash & credit facilities
SEK 5.2bn
Beginning of May 2023
25View entire presentation