Moelis & Company Investment Banking Pitch Book
Weighted Average Cost of Capital Analysis
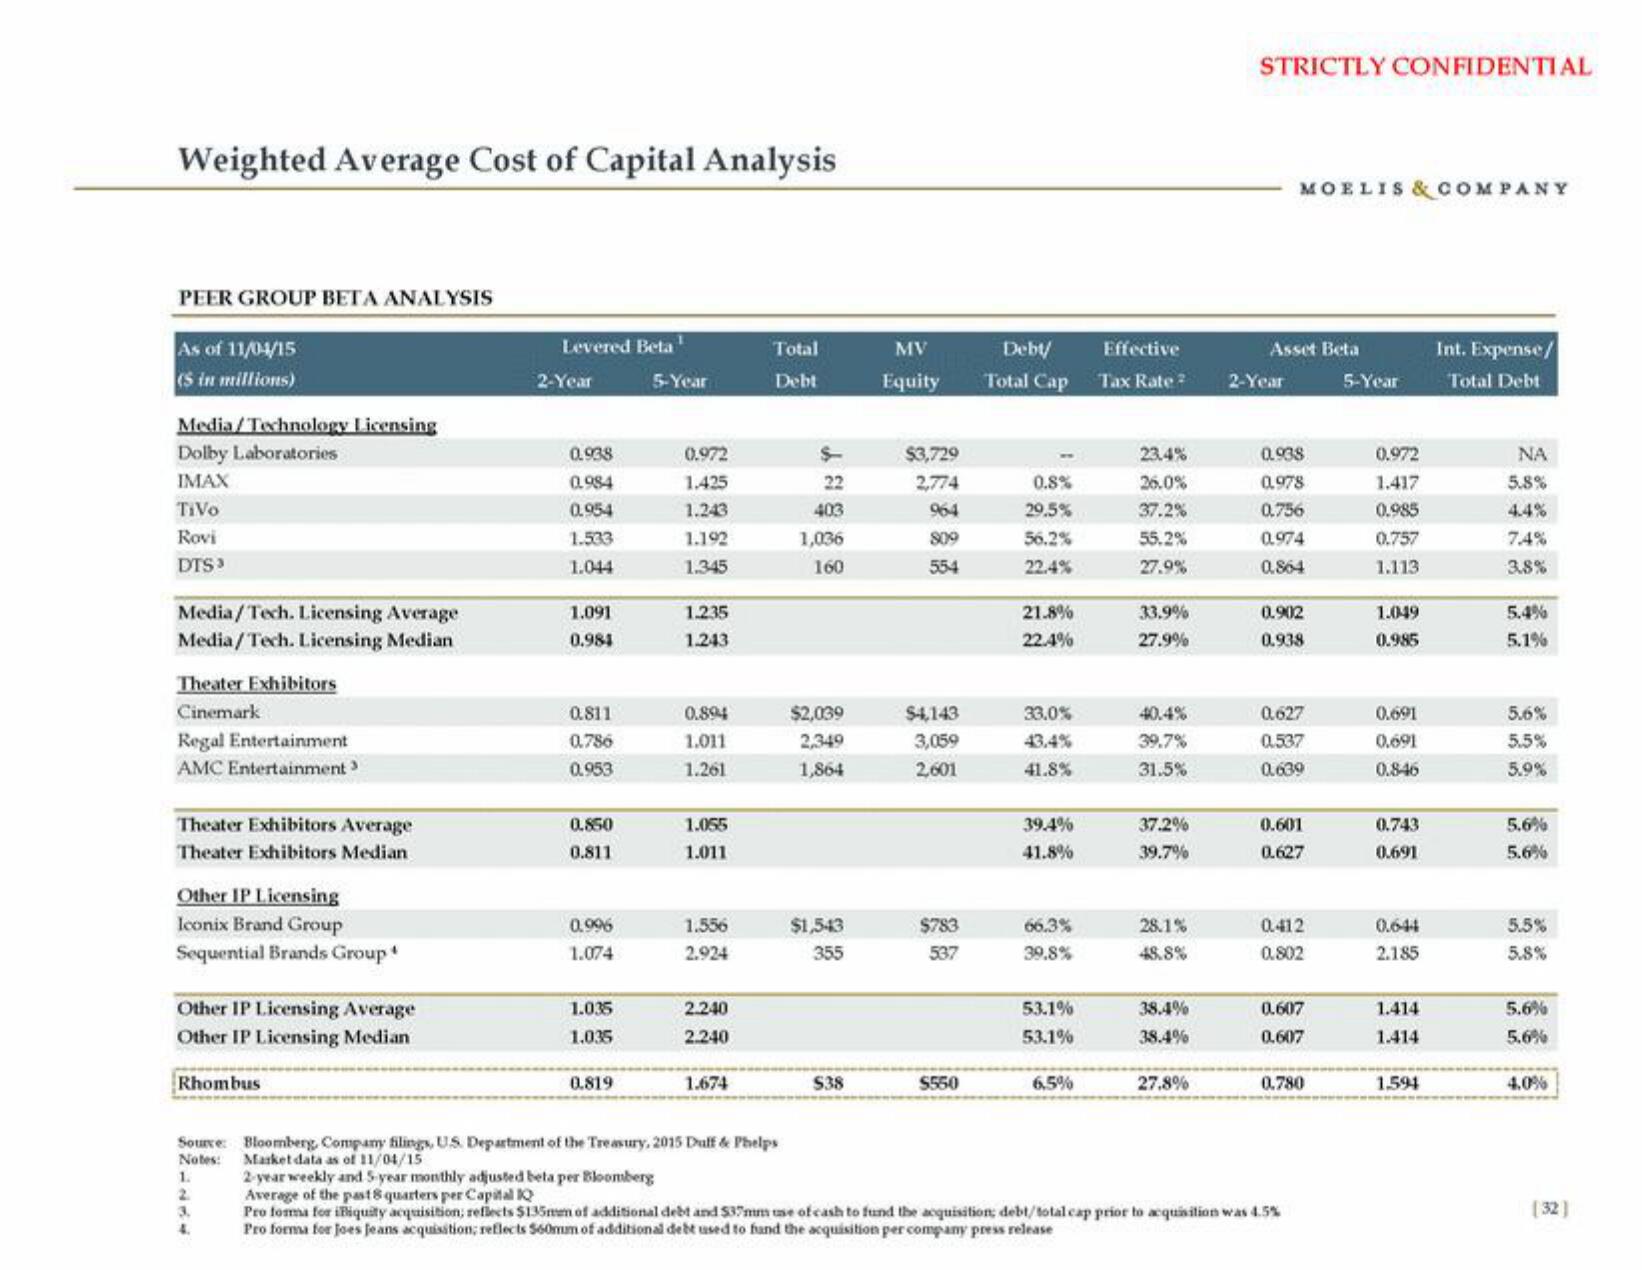
PEER GROUP BETA ANALYSIS
As of 11/04/15
(S in millions)
Media/Technology Licensing
Dolby Laboratories
IMAX
TiVo
Rovi
DTS³
Media/Tech. Licensing Average
Media/Tech. Licensing Median
Theater Exhibitors
Cinemark
Regal Entertainment
AMC Entertainment ³
Theater Exhibitors Average
Theater Exhibitors Median
Other IP Licensing
Iconix Brand Group
Sequential Brands Group
Other IP Licensing Average
Other IP Licensing Median
Rhombus
Levered Beta¹
1.
2
3.
4.
2-Year
0.938
0.984
0.954
1.533
1.044
1.091
0.984
0.811
0.786
0.953
0.850
0.811
0.996
1.074
1.035
1.035
0.819
5-Year
0.972
1.425
1.243
1.192
1.345
1.235
1.243
0.894
1.011
1.261
1.055
1.011
1.556
2.924
2.240
2.240
1.674
Total
Debt
Source: Bloomberg, Company filings, US Department of the Treasury, 2015 Duff & Phelps
Notes:
Market data as of 11/04/15
22
403
1,036
160
$2,039
2,349
1,864
$1,543
355
$38
MV
Equity
$3,729
2,774
964
809
554
$4,143
3,059
2,601
$783
537
$550
Debt/
Total Cap
0.8%
29.5%
56.2%
22.4%
21.8%
22.4%
33.0%
43,4%
41.8%
39.4%
41.8%
66.3%
39.8%
53.1%
53.1%
6,5%
Effective
Tax Rate 2
23.4%
26.0%
37.2%
55.2%
27.9%
33.9%
27.9%
40.4%
39.7%
31.5%
37.2%
39.7%
28.1%
48.8%
38.4%
38.4%
27.8%
STRICTLY CONFIDENTIAL
Asset Beta
2-Year
MOELIS & COMPANY
0.938
0,978
0.756
0.974
0.864
0.902
0.938
0.627
0.537
0.639
0.601
0.627
0.412
0.802
0.607
0.607
0.780
2-year weekly and 5-year monthly adjusted beta per Bloomberg
Average of the past 8 quarters per Capital Q
Pro forma for iBiquity acquisition; reflects $135mm of additional debt and $37mm use of cash to fund the acquisition; debt/total cap prior to acquisition was 4.5%
Pro forma for Joes Jeans acquisition; reflects 560mm of additional debt used to fund the acquisition per company press release
5-Year
0.972
1.417
0.985
0.757
1.113
1.049
0.985
0.691
0.691
0.846
0.743
0.691
0.644
2.185
1.414
1.414
1.594
Int. Expense/
Total Debt
ΝΑ
5.8%
4.4%
7.4%
3.8%
5.4%
5.1%
5.6%
5.5%
5.9%
5.6%
5.6%
5.5%
5.8%
5.6%
5.6%
4.0%
[32]View entire presentation