Bank of America Investment Banking Pitch Book
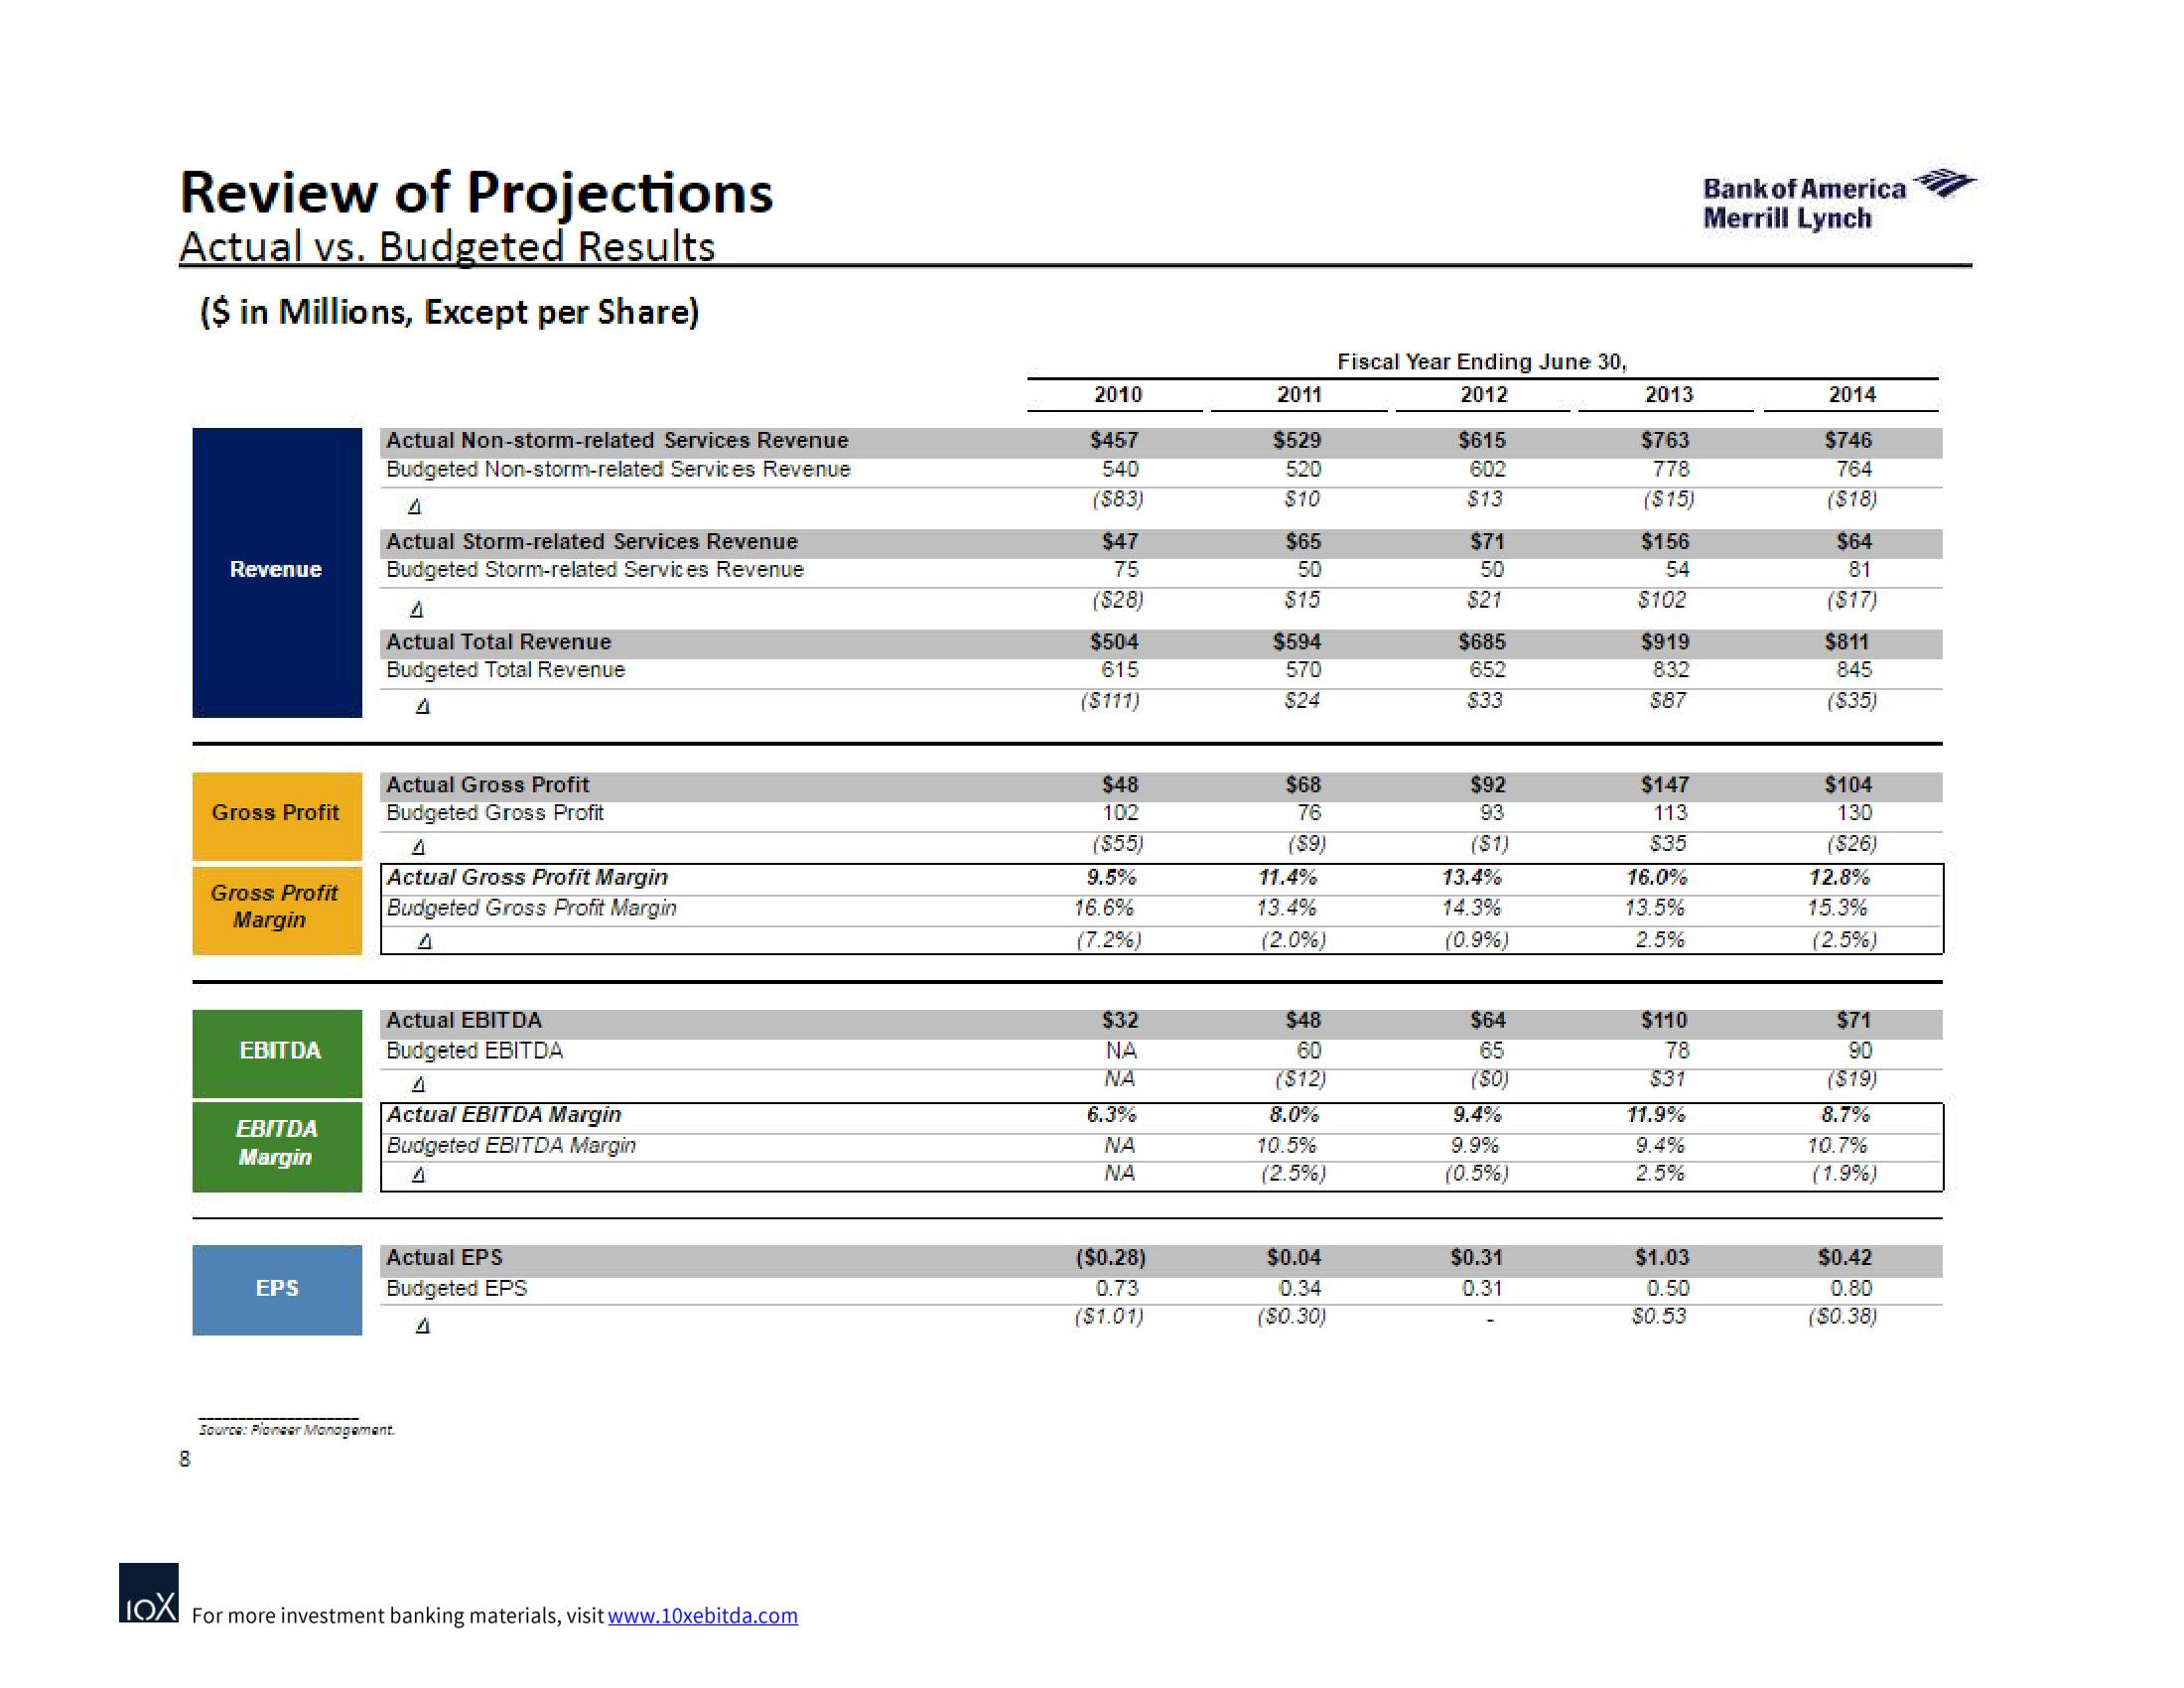
Review of Projections
Actual vs. Budgeted Results
($ in Millions, Except per Share)
8
Revenue
Gross Profit
Gross Profit
Margin
EBITDA
EBITDA
Margin
EPS
Actual Non-storm-related Services Revenue
Budgeted Non-storm-related Services Revenue
Actual Storm-related Services Revenue
Budgeted Storm-related Services Revenue
Actual Total Revenue
Budgeted Total Revenue
Actual Gross Profit
Budgeted Gross Profit
Actual Gross Profit Margin
Budgeted Gross Profit Margin
4
Actual EBITDA
Budgeted EBITDA
4
Actual EBITDA Margin
Budgeted EBITDA Margin
Actual EPS
Budgeted EPS
Source: Pioneer Management.
IOX For more investment banking materials, visit www.10xebitda.com
2010
$457
540
($83)
$47
75
($28)
$504
615
($111)
$48
102
($55)
9.5%
16.6%
(7.2%)
$32
ΝΑ
NA
6.3%
NA
NA
($0.28)
0.73
($1.01)
2011
$529
520
$10
$65
50
$15
$594
570
$24
$68
76
($9)
11.4%
13.4%
(2.0%)
$48
60
($12)
8.0%
10.5%
(2.5%)
$0.04
0.34
($0.30)
Fiscal Year Ending June 30,
2012
$615
602
$13
$71
50
$21
$685
652
$33
$92
93
($1)
13.4%
14.3%
(0.9%)
$64
65
(SO)
9.9%
(0.5%)
$0.31
0.31
2013
$763
778
($15)
$156
54
$102
$919
832
$87
$147
113
$35
16.0%
13.5%
2.5%
$110
78
$31
11.9%
2.5%
$1.03
0.50
$0.53
Bank of America
Merrill Lynch
2014
$746
764
($18)
$64
81
($17)
$811
845
($35)
$104
130
($26)
12.8%
15.3%
(2.5%)
$71
90
($19)
8.7%
10.7%
(1.9%)
$0.42
0.80
($0.38)View entire presentation