Deutsche Bank Results Presentation Deck
Corporate & Other
In € m, unless stated otherwise
Financial results
Statement of income
Revenues
Provision for credit losses
Noninterest expenses
Adjusted costs
Noncontrolling interests
Profit (loss) before tax
Balance sheet and resources
Leverage exposure, in € bn
Risk-weighted assets, in € bn
Q1 2023
Note: for footnotes refer to slides 45 and 46
Deutsche Bank
Investor Relations
(10)
1
241
A vs.
A vs.
Q1 2022 Q4 2022
(97)%
(82)%
252 (31)% (26)%
43
(30)%
(37) (33)%
37 (35)%
(96)%
n.m.
(10)%
(226) (67)% (58)%
35%
(2)%
2%
(6)%
Q1 2023 results
April 27, 2023
Profit (loss) before tax
Funding &
liquidity
Valuation &
timing differences¹
Legacy portfolios²
Shareholder
expenses
Other
Noncontrolling
interests³
Profit (loss)
before tax
(106)
(130)
(124)
(142)
(226)
37
Abs. A vs.
Q1 2022
21
239 423
166
(4)
(136)
(19)
451
Key highlights
/
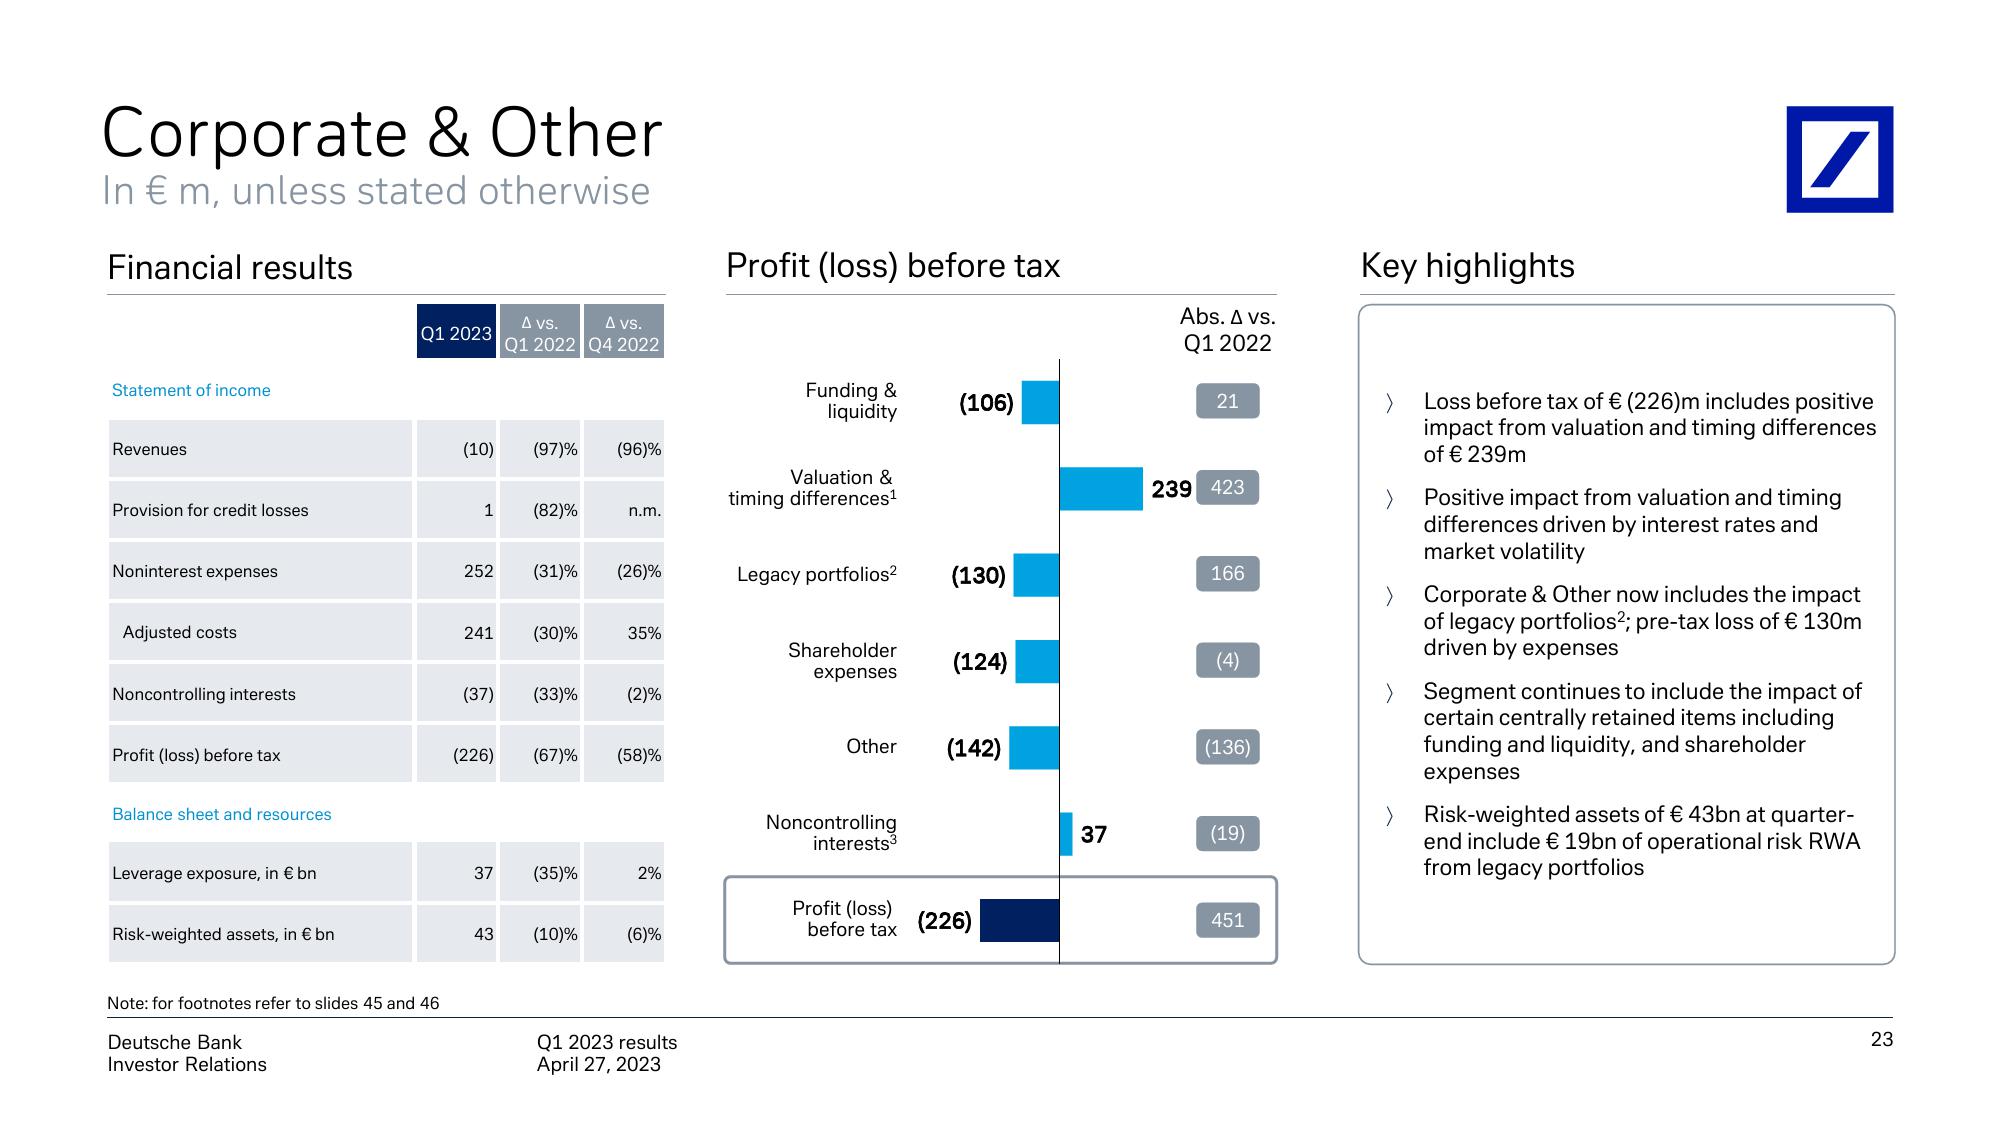
Loss before tax of € (226)m includes positive
impact from valuation and timing differences
of € 239m
Positive impact from valuation and timing
differences driven by interest rates and
market volatility
Corporate & Other now includes the impact
of legacy portfolios2; pre-tax loss of € 130m
driven by expenses
Segment continues to include the impact of
certain centrally retained items including
funding and liquidity, and shareholder
expenses
Risk-weighted assets of € 43bn at quarter-
end include € 19bn of operational risk RWA
from legacy portfolios
23View entire presentation