Conference Presentation
Financial Snapshot
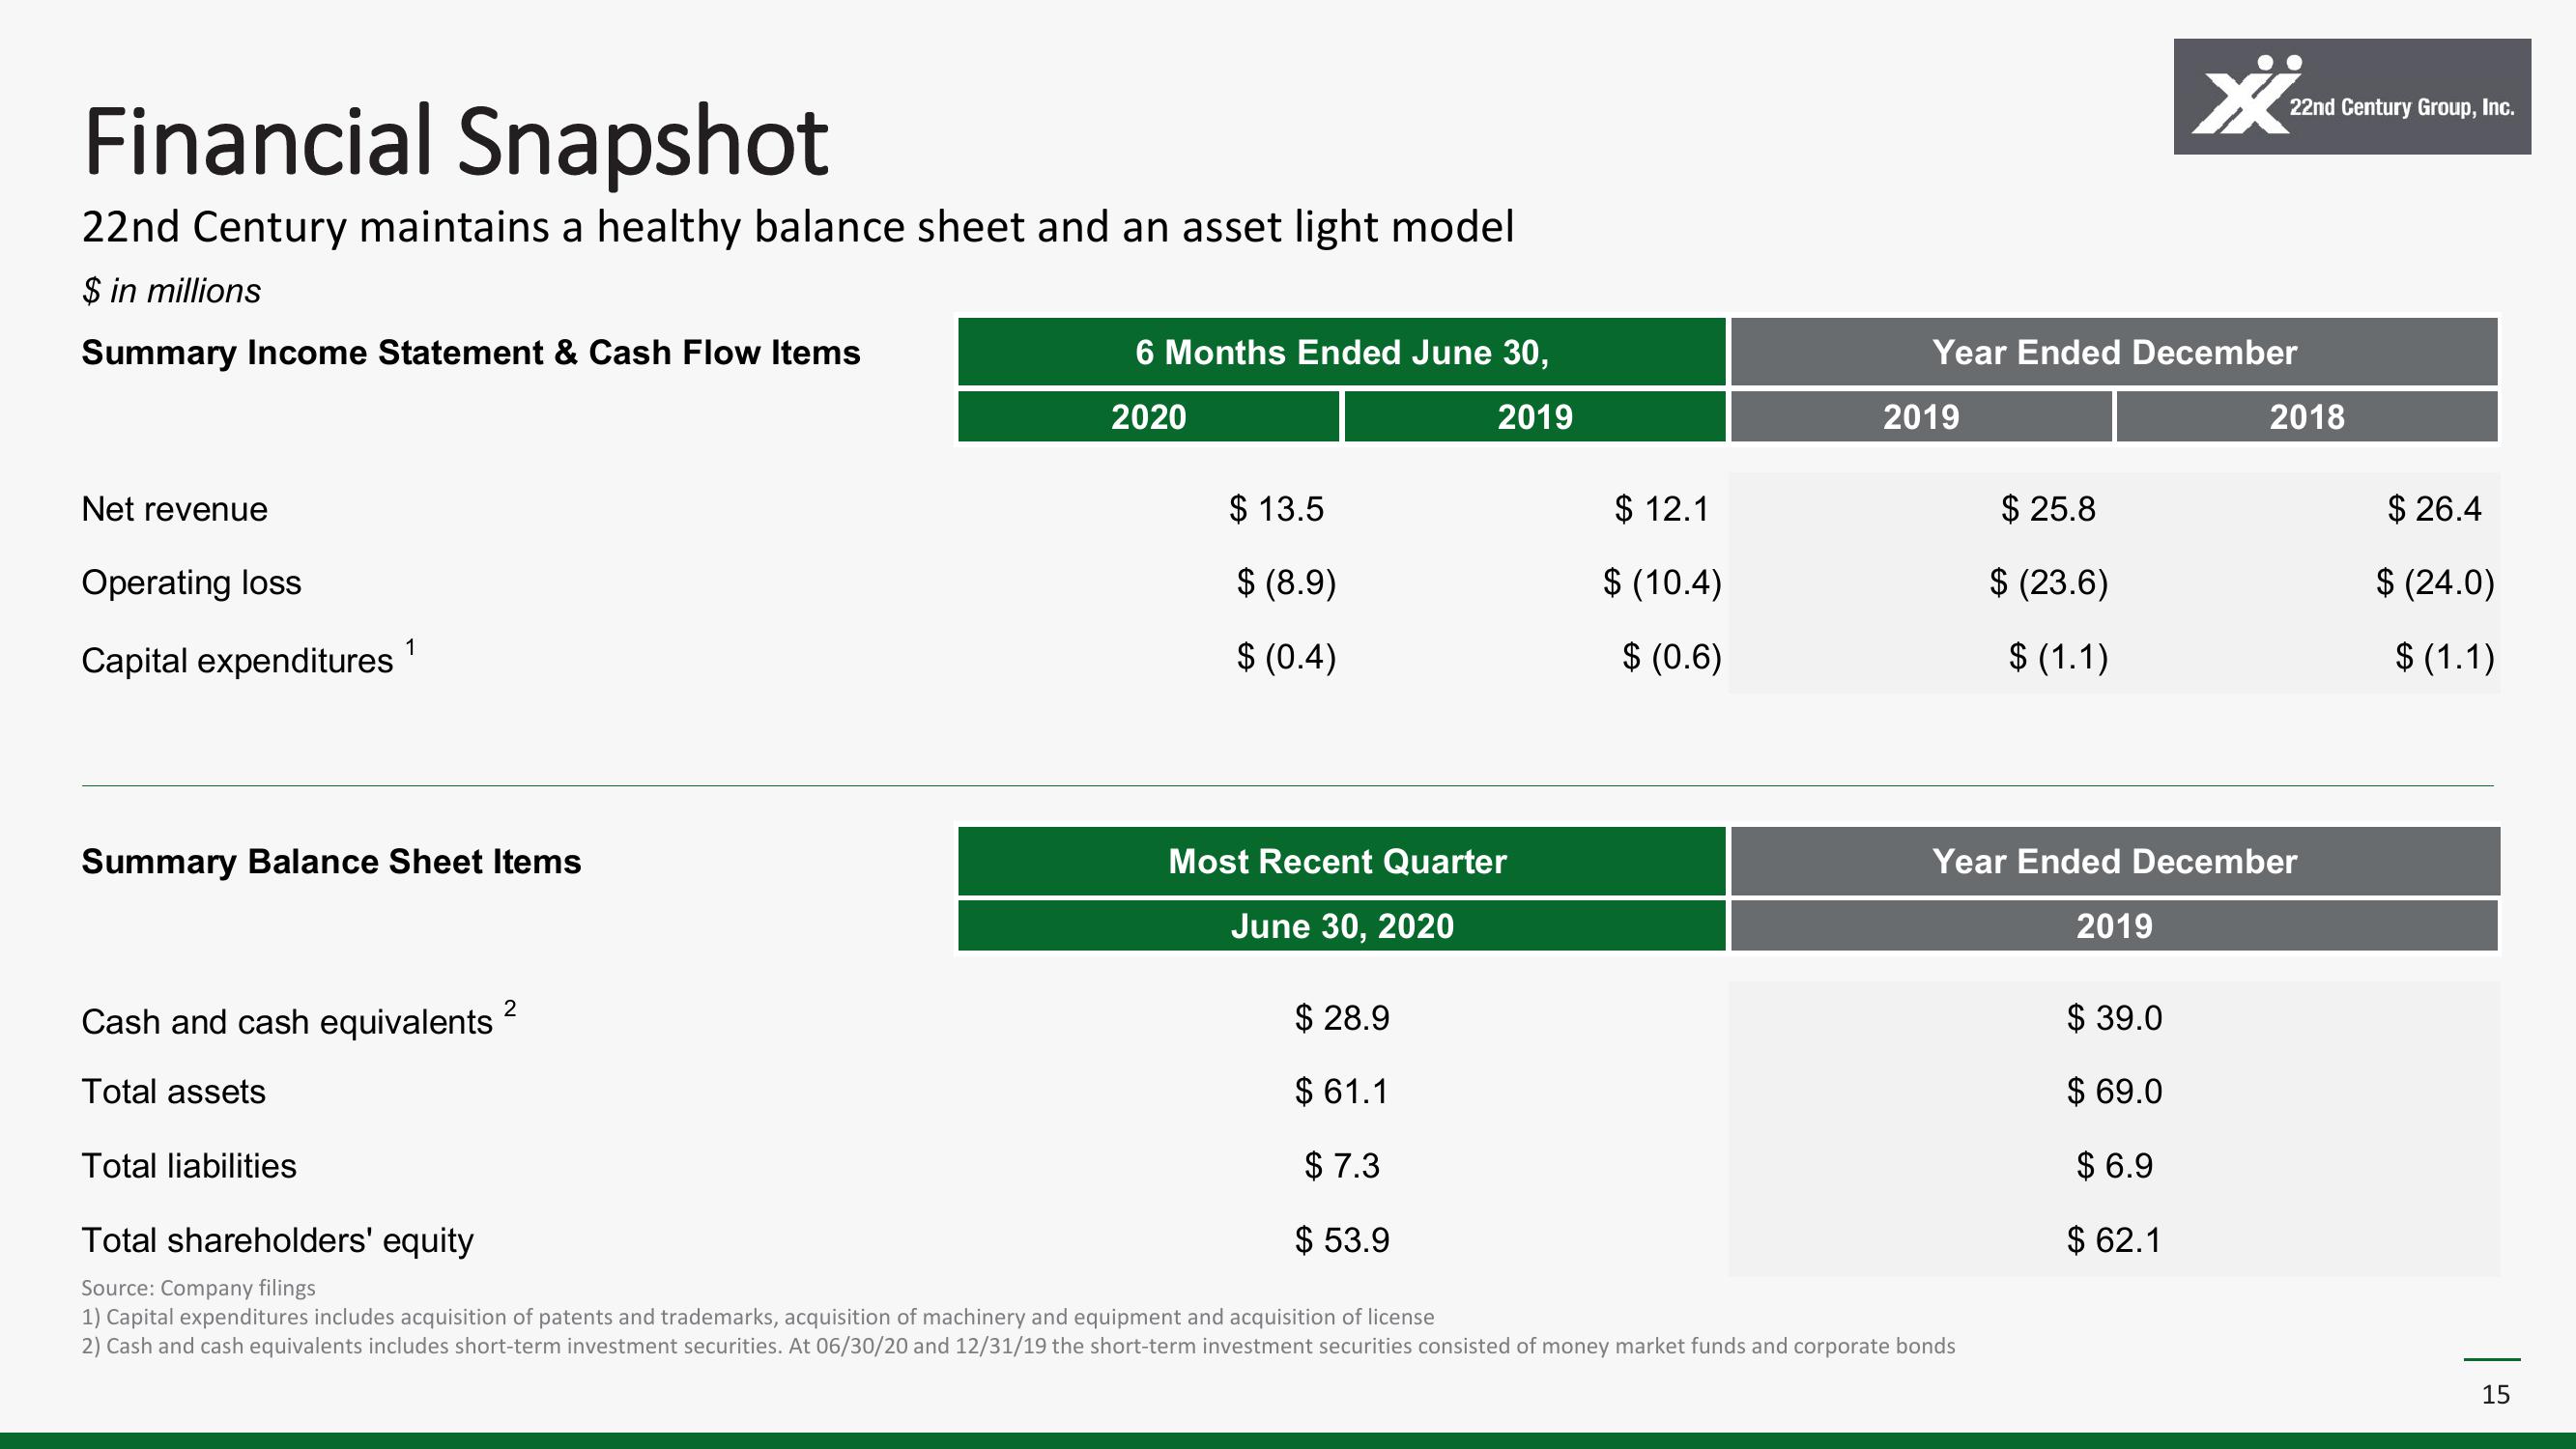
22nd Century maintains a healthy balance sheet and an asset light model
$ in millions
Summary Income Statement & Cash Flow Items
Net revenue
Operating loss
Capital expenditures
Summary Balance Sheet Items
2
6 Months Ended June 30,
2020
2019
$13.5
$ (8.9)
$ (0.4)
Most Recent Quarter
June 30, 2020
$28.9
$61.1
$7.3
$ 53.9
$ 12.1
$ (10.4)
$ (0.6)
2019
Year Ended December
$25.8
$ (23.6)
$(1.1)
Cash and cash equivalents
Total assets
Total liabilities
Total shareholders' equity
Source: Company filings
1) Capital expenditures includes acquisition of patents and trademarks, acquisition of machinery and equipment and acquisition of license
2) Cash and cash equivalents includes short-term investment securities. At 06/30/20 and 12/31/19 the short-term investment securities consisted of money market funds and corporate bonds
Ž
2019
22nd Century Group, Inc.
Year Ended December
$39.0
$69.0
$6.9
$ 62.1
2018
$26.4
$ (24.0)
$(1.1)
15View entire presentation