Telia Company Results Presentation Deck
TV & MEDIA
1582 1633
Service revenues
Reported currency, in millions, like for like growth
●
10
+45.1%
2 340
1904
Q2 20 Q3 20 Q4 20 Q1 21 Q2 21
TV Advertising Other
2 271
Adj EBITDA
Reported currency, in millions, like for like growth
311
249
+84.7%
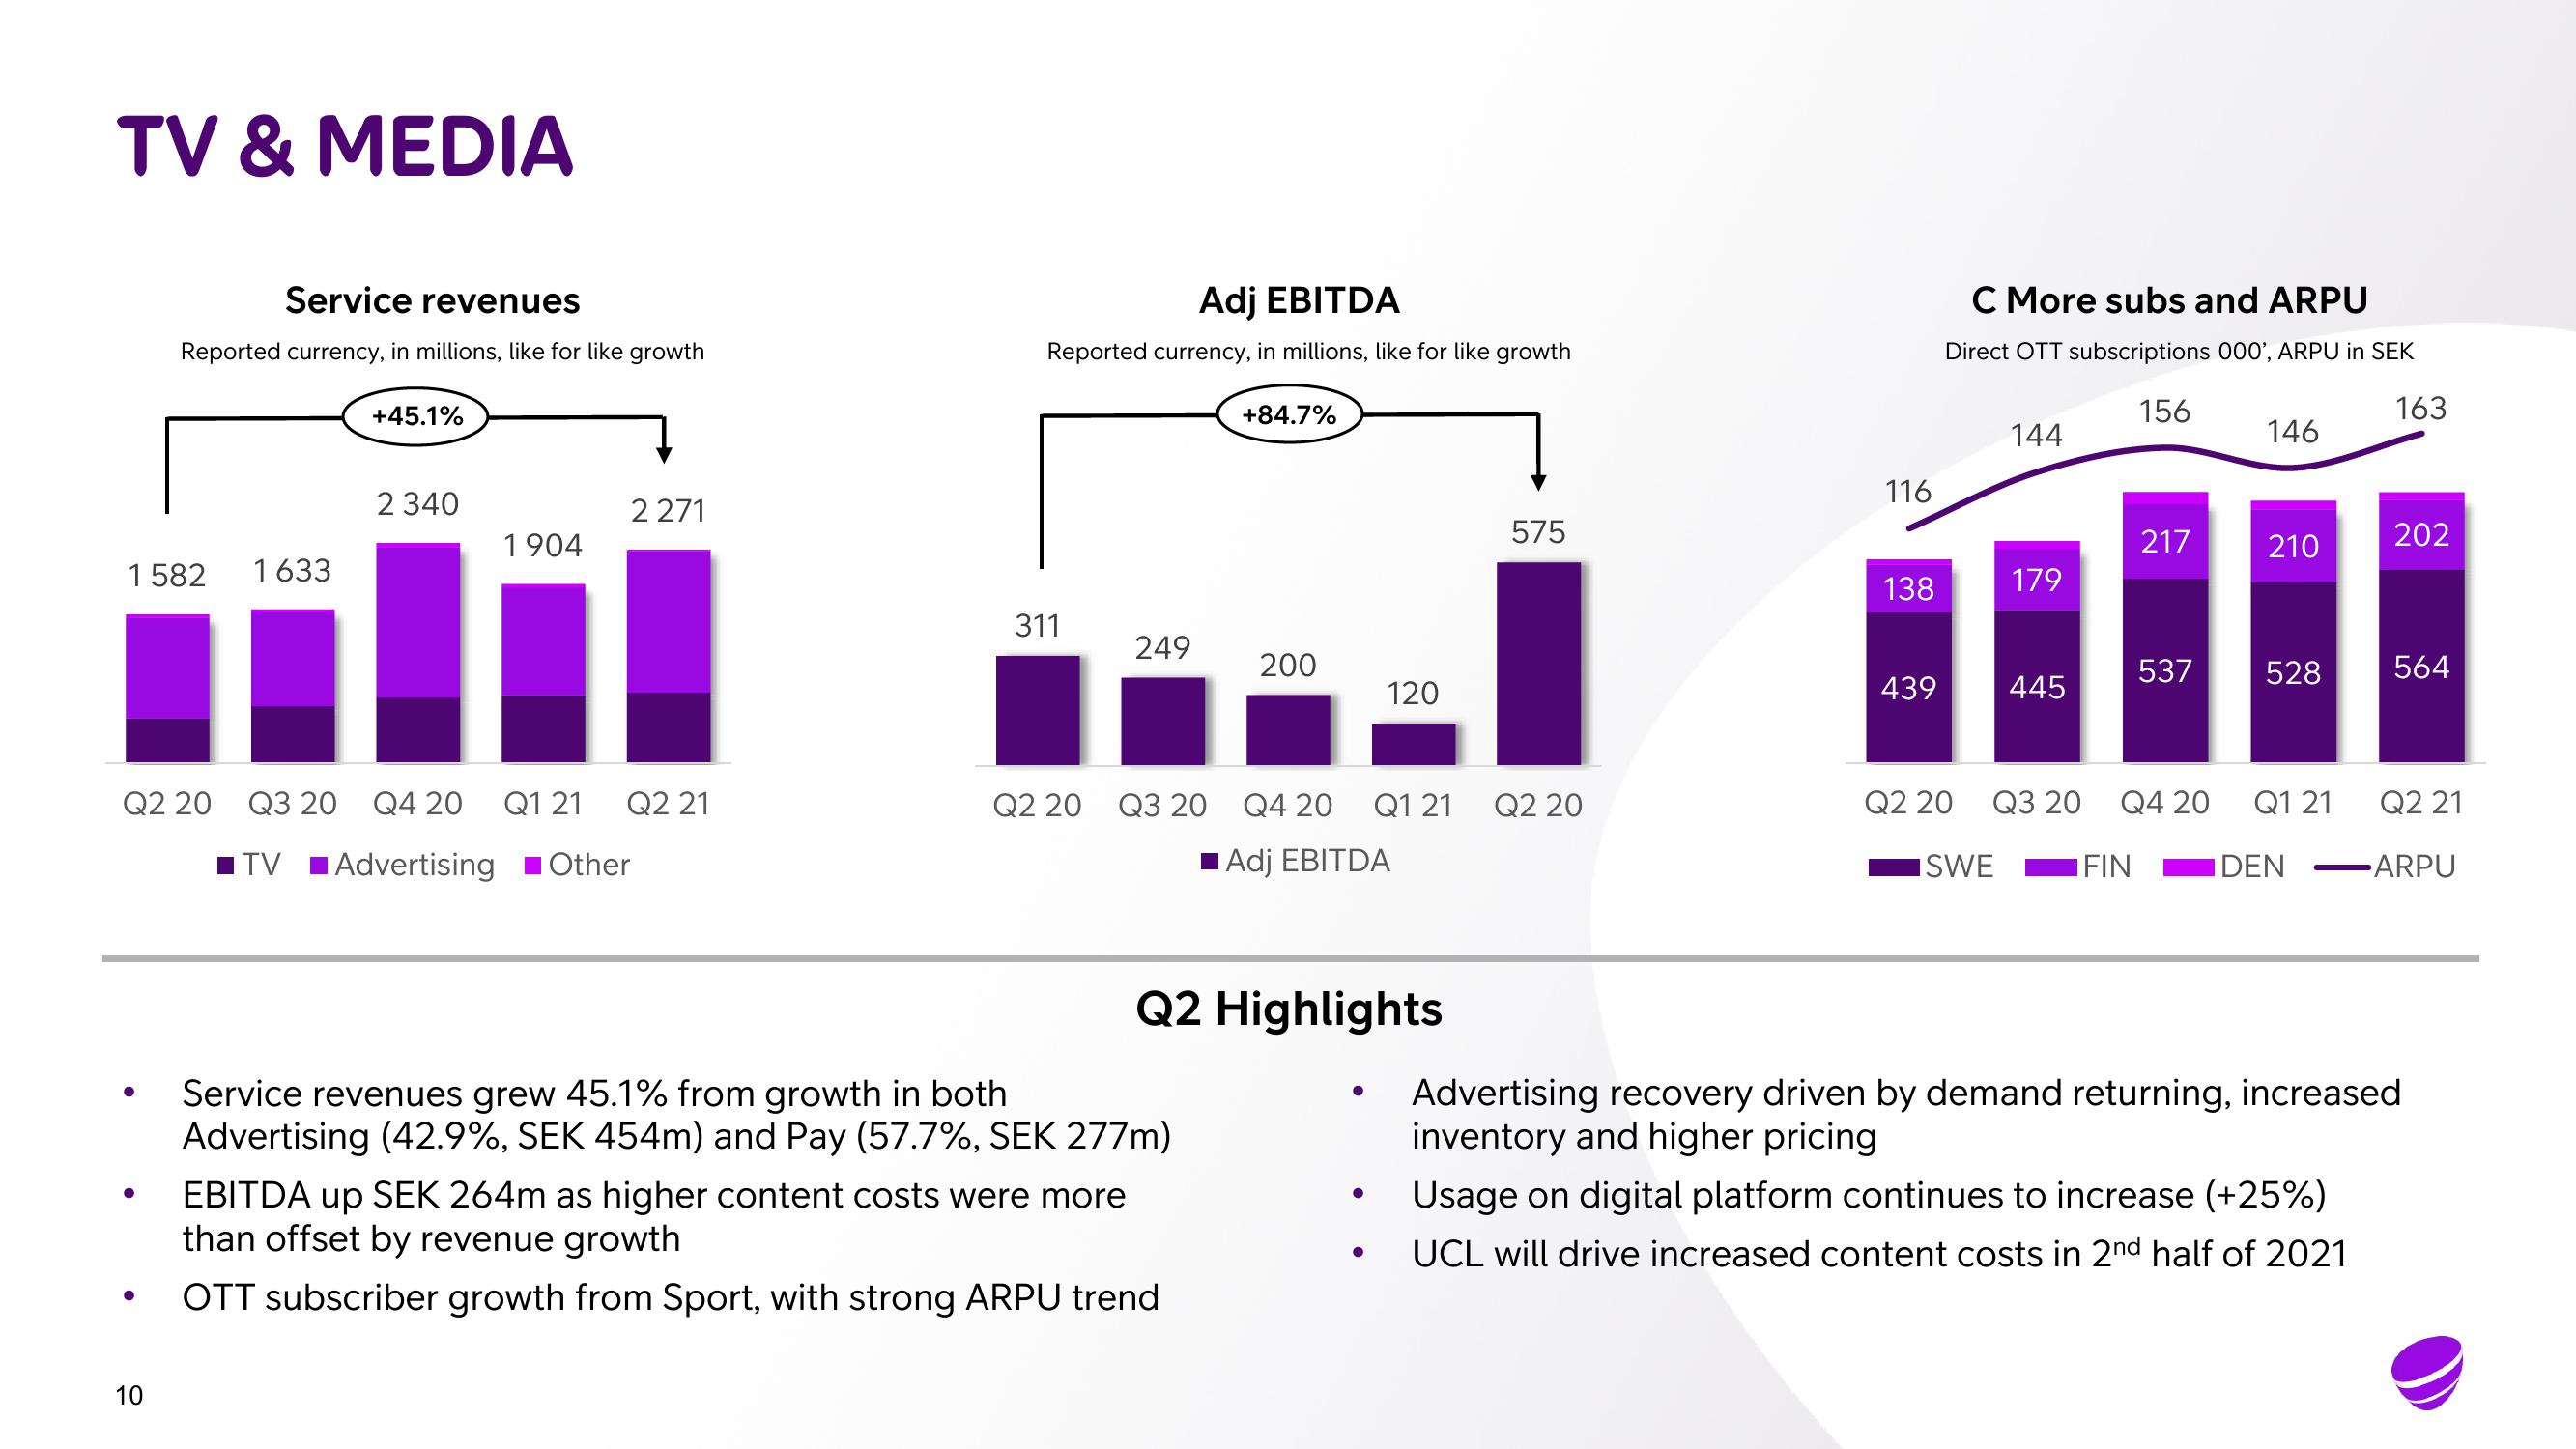
Service revenues grew 45.1% from growth in both
Advertising (42.9%, SEK 454m) and Pay (57.7%, SEK 277m)
200
Q2 20 Q3 20 Q4 20
■Adj EBITDA
EBITDA up SEK 264m as higher content costs were more
than offset by revenue growth
OTT subscriber growth from Sport, with strong ARPU trend
Q2 Highlights
120
●
Q1 21
●
575
Q2 20
116
138
439
C More subs and ARPU
Direct OTT subscriptions 000', ARPU in SEK
156
163
Q2 20
ISWE
144
179
445
Q3 20
217
FIN
Q4 20
146
210
537 528
Q1 21
DEN
202
Usage on digital platform continues to increase (+25%)
UCL will drive increased content costs in 2nd half of 2021
564
Q2 21
-ARPU
Advertising recovery driven by demand returning, increased
inventory and higher pricingView entire presentation