Melrose Results Presentation Deck
Nortek Air Management: highlights
Melrose
£m
Revenue
EBITDA
EBITDA margin %
Operating profit
Operating margin %
■
■
■
2020
Adjusted¹ results
1,227
227
Buy
Improve
Sell
18.5%
1.
2.
3.
4.
188
15.3%
Growth²
5%
10%
0.8 ppts
8%
0.5 ppts
H2 2020
Adjusted¹
results
677
136
20.1%
Highlights
Outstanding performance throughout 2020-sales, operating profit and operating margin expansion
Strong retail sales due to home remodelling and innovative new products
Commercial backlog strong, data centre opportunities remain excellent
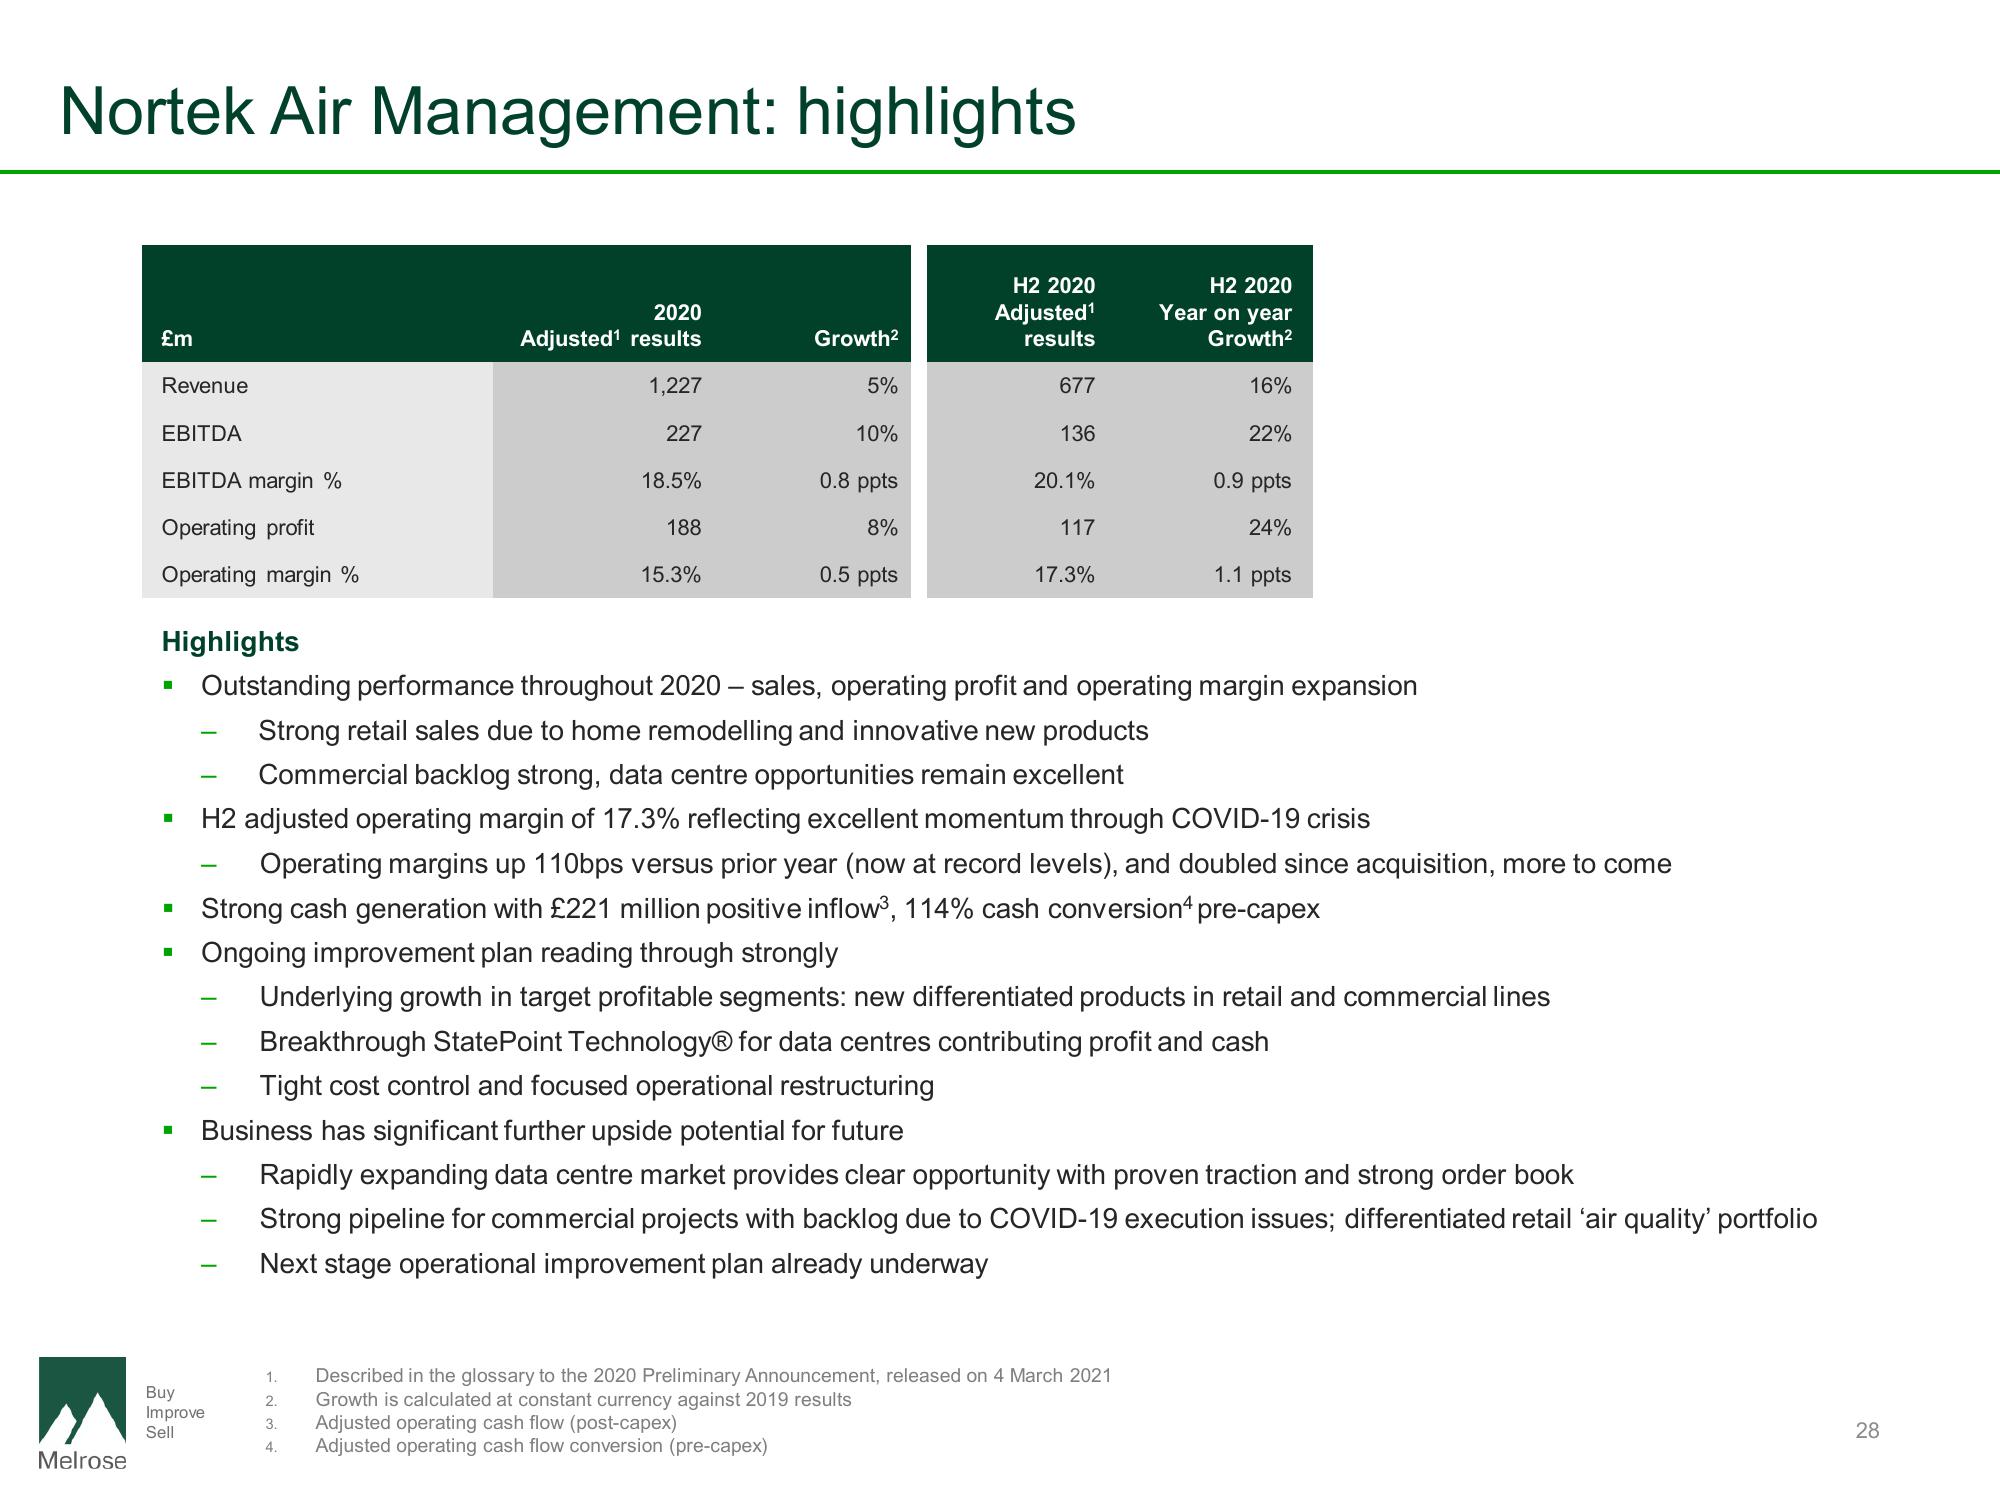
H2 adjusted operating margin of 17.3% reflecting excellent momentum through COVID-19 crisis
Operating margins up 110bps versus prior year (now at record levels), and doubled since acquisition, more to come
Strong cash generation with £221 million positive inflow³, 114% cash conversion4 pre-capex
117
17.3%
H2 2020
Year on year
Growth²
Ongoing improvement plan reading through strongly
Underlying growth in target profitable segments: new differentiated products in retail and commercial lines
Breakthrough StatePoint Technology® for data centres contributing profit and cash
Tight cost control and focused operational restructuring
Business has significant further upside potential for future
Rapidly expanding data centre market provides clear opportunity with proven traction and strong order book
Strong pipeline for commercial projects with backlog due to COVID-19 execution issues; differentiated retail 'air quality' portfolio
Next stage operational improvement plan already underway
16%
22%
0.9 ppts
24%
1.1 ppts
Described in the glossary to the 2020 Preliminary Announcement, released on 4 March 2021
Growth is calculated at constant currency against 2019 results
Adjusted operating cash flow (post-capex)
Adjusted operating cash flow conversion (pre-capex)
28View entire presentation