Babylon SPAC Presentation Deck
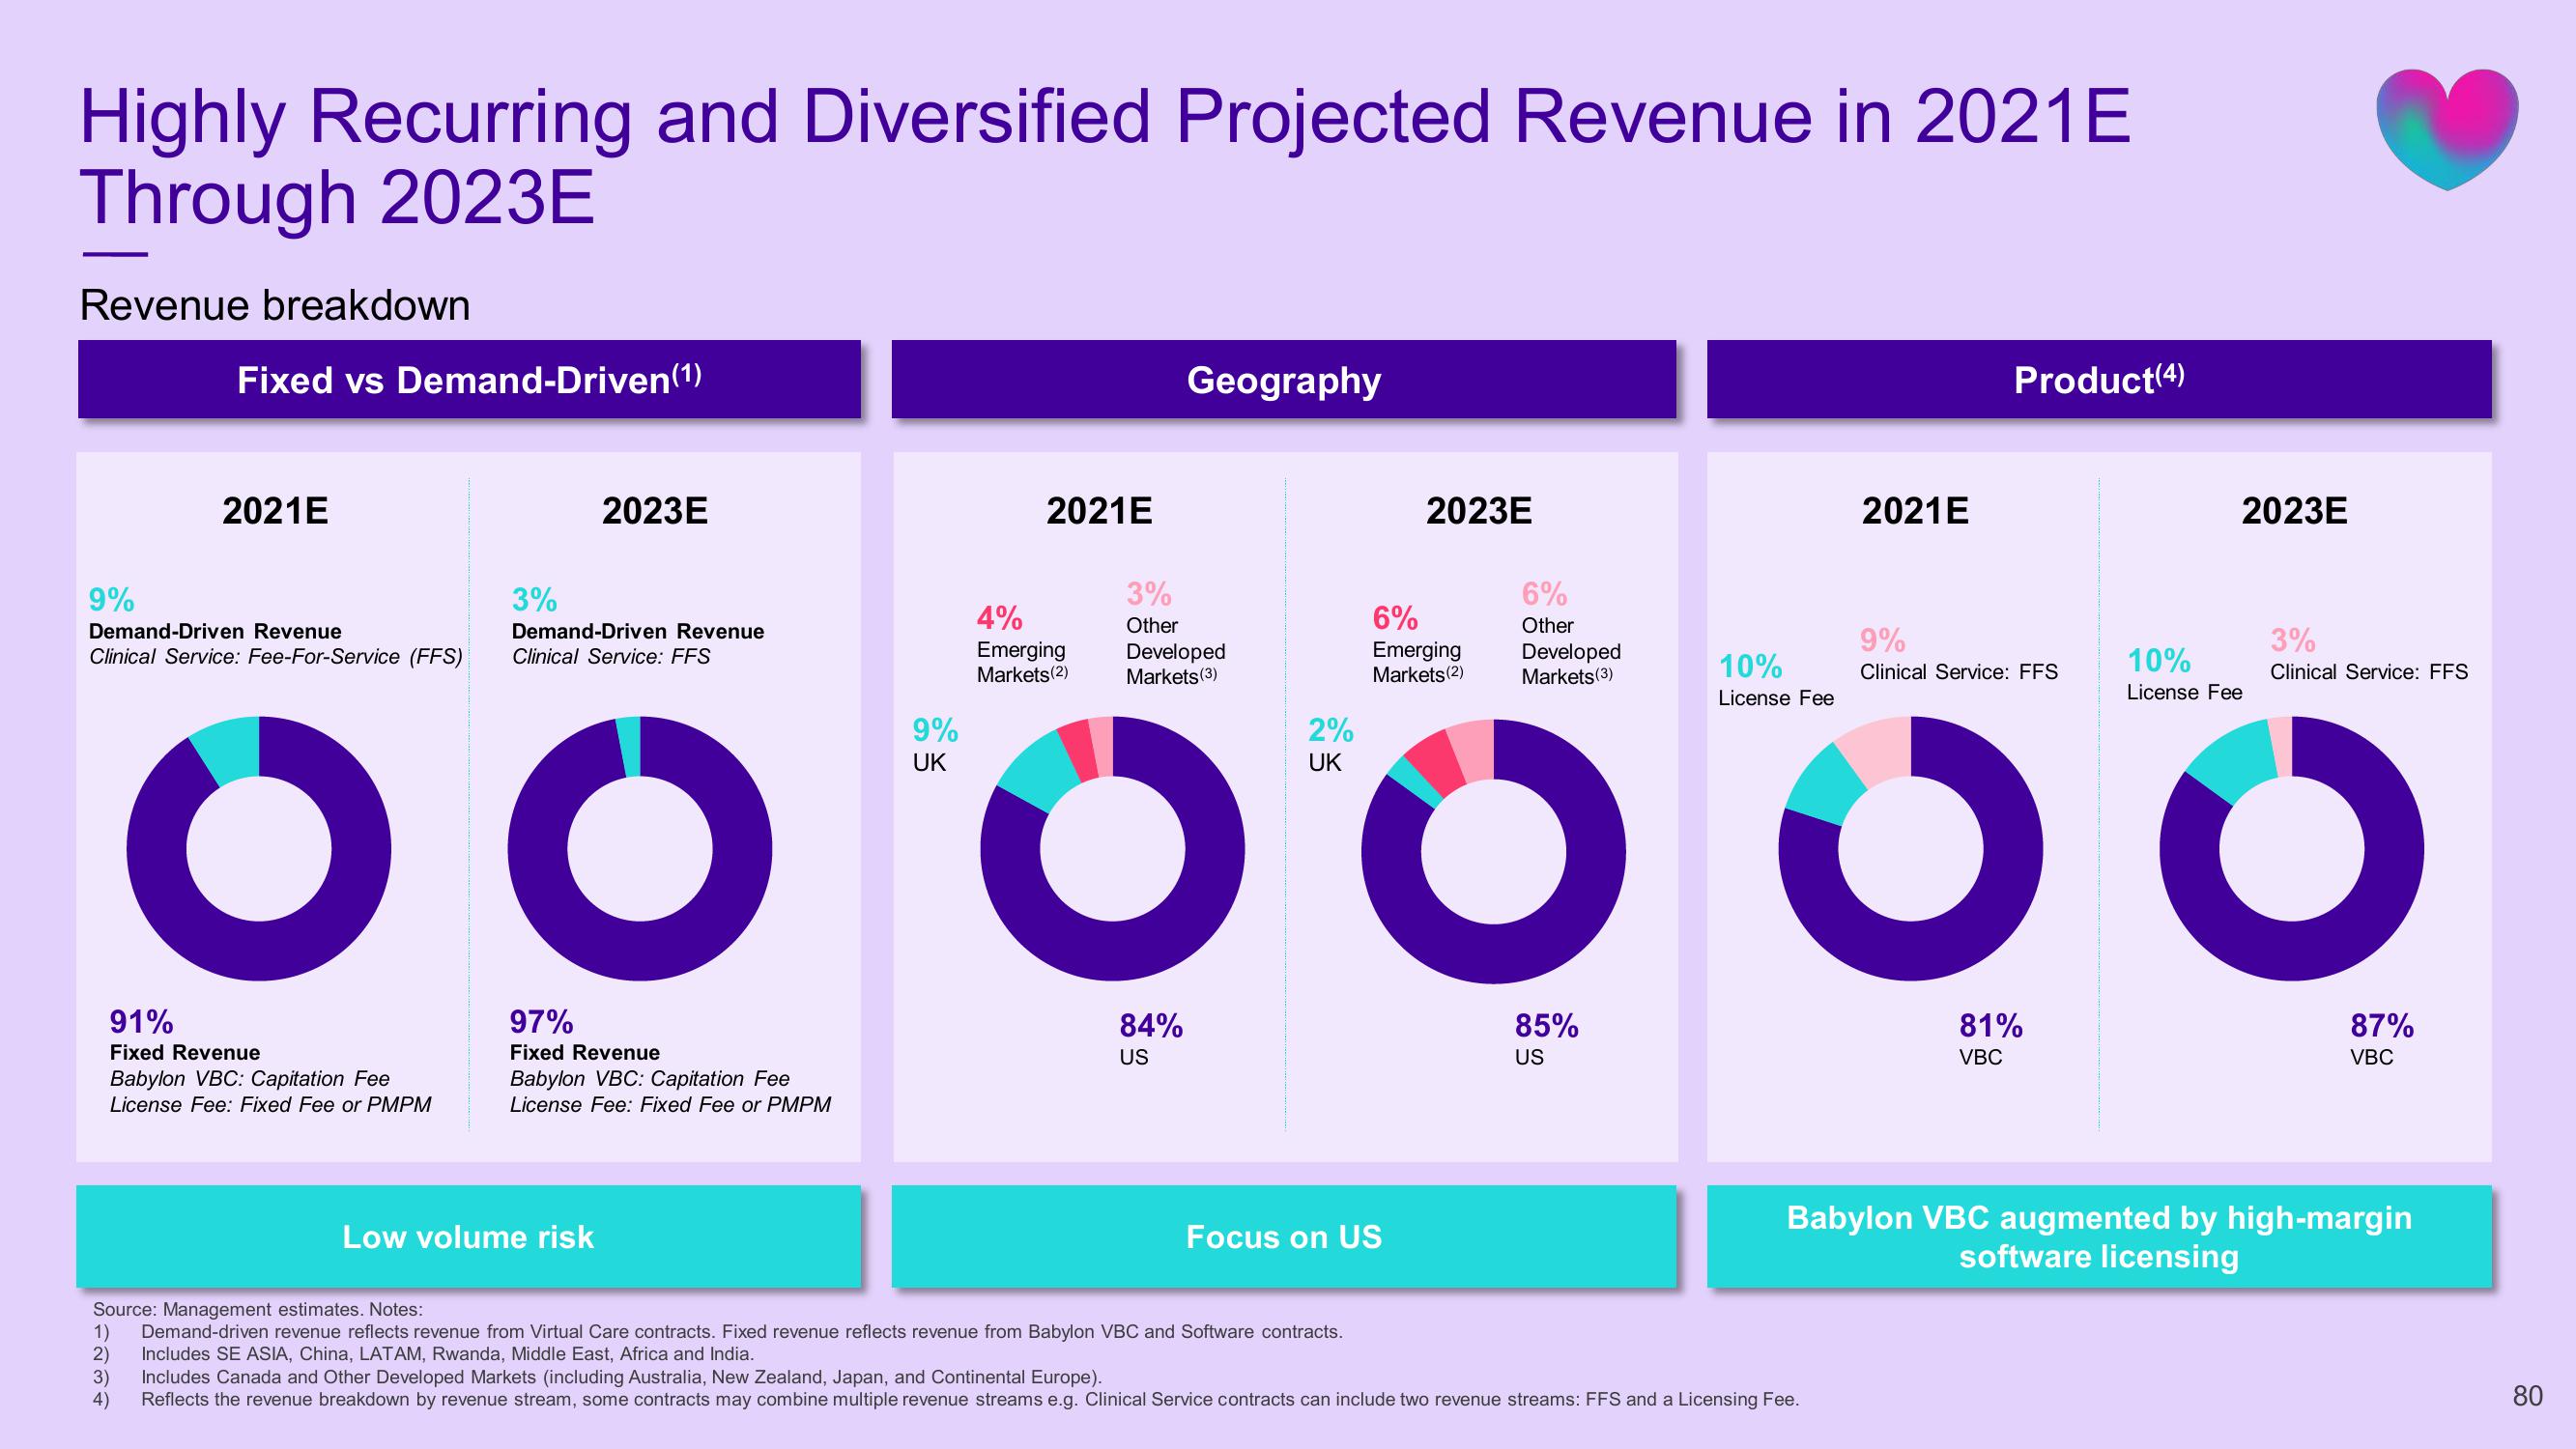
Highly Recurring and Diversified Projected Revenue in 2021E
Through 2023E
Revenue breakdown
1234
Fixed vs Demand-Driven(1)
2021E
9%
Demand-Driven Revenue
Clinical Service: Fee-For-Service (FFS)
OO
91%
Fixed Revenue
Babylon VBC: Capitation Fee
License Fee: Fixed Fee or PMPM
3)
4)
2023E
3%
Demand-Driven Revenue
Clinical Service: FFS
97%
Fixed Revenue
Babylon VBC: Capitation Fee
License Fee: Fixed Fee or PMPM
Low volume risk
9%
UK
2021E
4%
Emerging
Markets (2)
Geography
3%
Other
Developed
Markets (3)
84%
US
2023E
6%
Emerging
Markets (2)
2%
UK
OO
Focus on US
6%
Other
Developed
Markets (3)
85%
US
Source: Management estimates. Notes:
1) Demand-driven revenue reflects revenue from Virtual Care contracts. Fixed revenue reflects revenue from Babylon VBC and Software contracts.
Includes SE ASIA, China, LATAM, Rwanda, Middle East, Africa and India.
2)
Includes Canada and Other Developed Markets (including Australia, New Zealand, Japan, and Continental Europe).
Reflects the revenue breakdown by revenue stream, some contracts may combine multiple revenue streams e.g. Clinical Service contracts can include two revenue streams: FFS and a Licensing Fee.
10%
License Fee
2021E
Product (4)
9%
Clinical Service: FFS
10%
License Fee
OO
2023E
81%
VBC
3%
Clinical Service: FFS
87%
VBC
Babylon VBC augmented by high-margin
software licensing
80View entire presentation