J.P.Morgan Investment Banking Pitch Book
VALUATION ANALYSIS
Discounted cash flow valuation
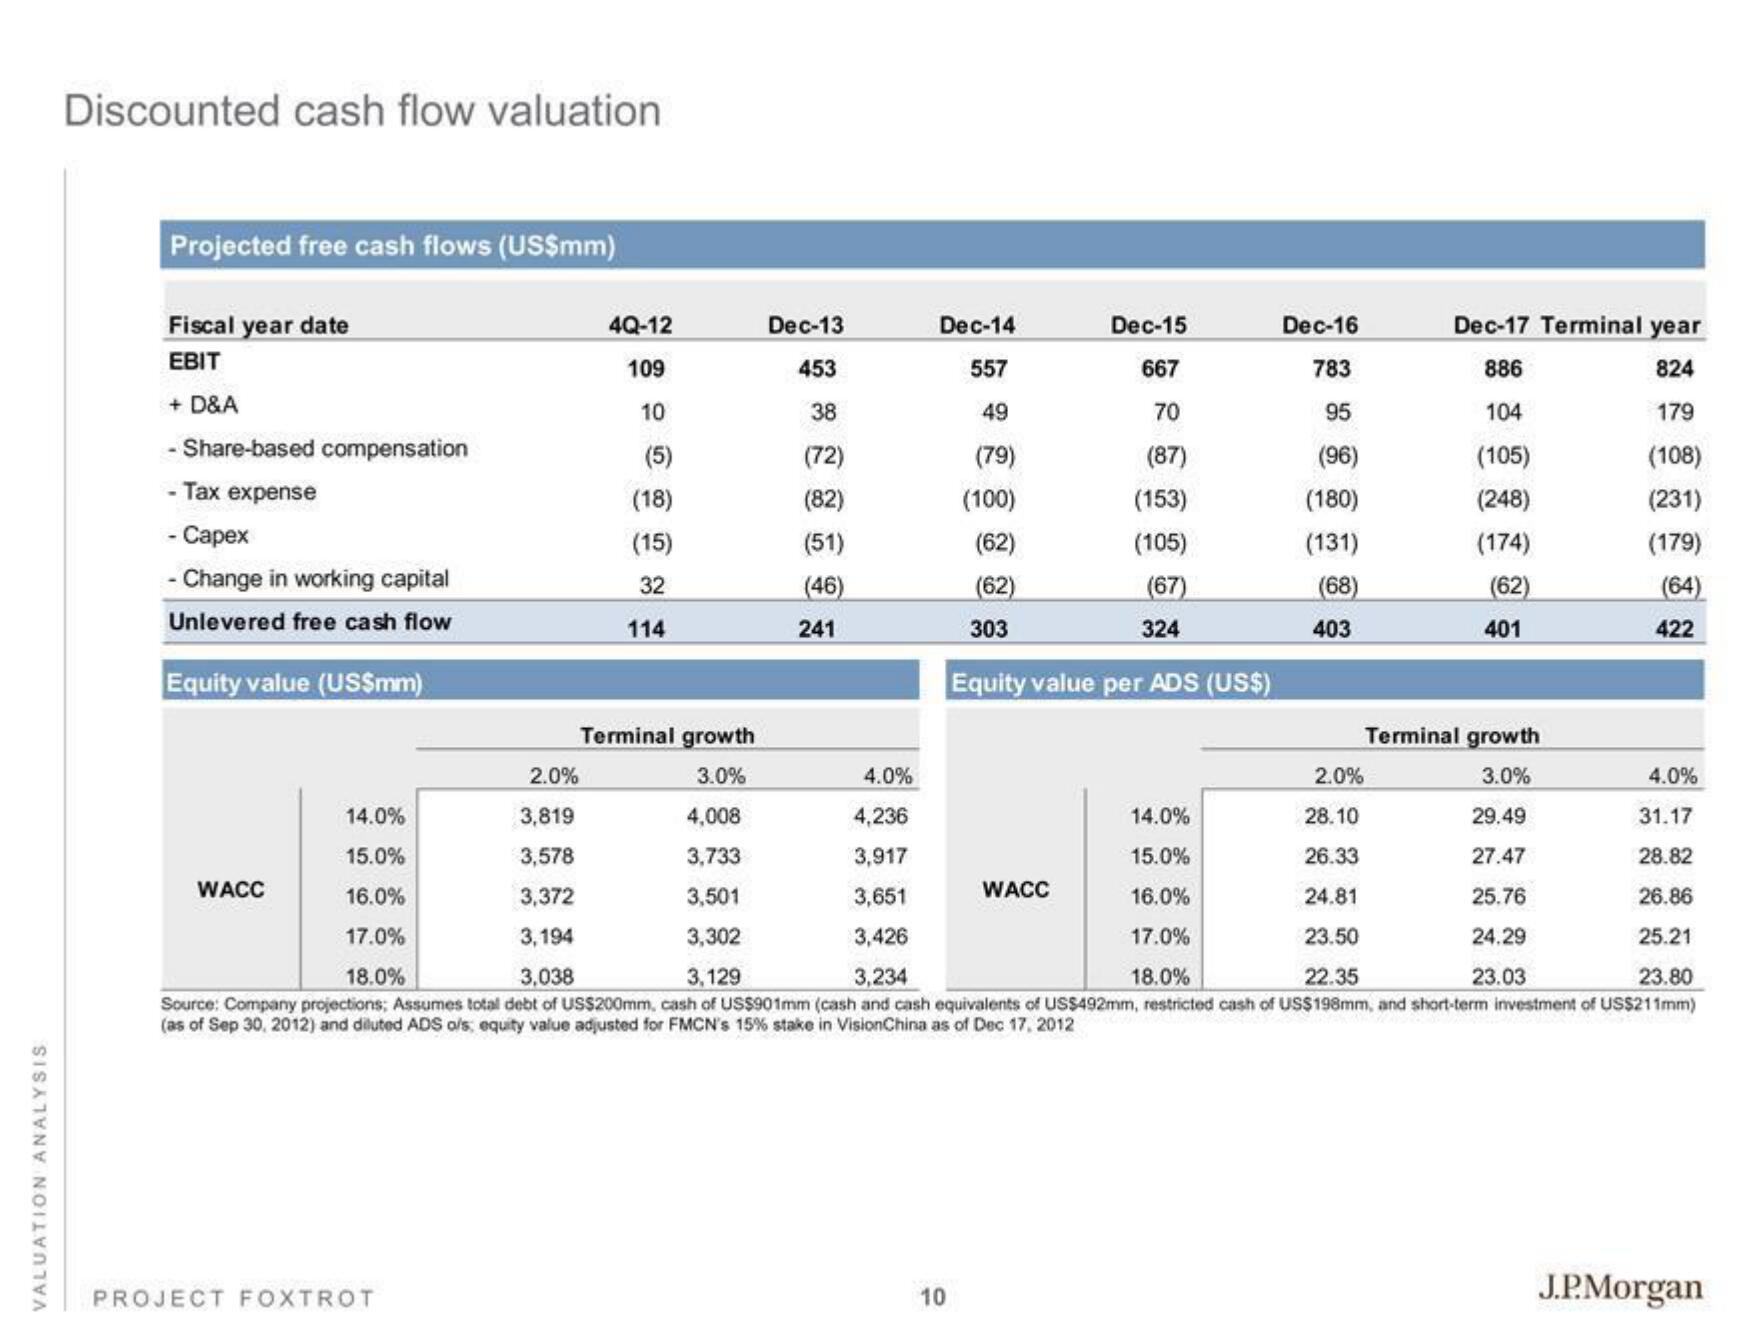
Projected free cash flows (US$mm)
Fiscal year date
EBIT
+ D&A
Share-based compensation
- Tax expense
- Capex
- Change in working capital
Unlevered free cash flow
Equity value (US$mm)
-
WACC
4Q-12
109
10
(5)
(18)
(15)
32
114
PROJECT FOXTROT
Terminal growth
3.0%
Dec-13
453
38
(72)
(82)
(51)
(46)
241
Dec-14
Dec-15
557
667
49
70
(79)
(87)
(100)
(153)
(62)
(105)
(62)
(67)
303
324
Equity value per ADS (US$)
10
Dec-16
783
95
(96)
(180)
(131)
(68)
403
2.0%
4.0%
4.0%
14.0%
3,819
4,008
4,236
14.0%
28.10
31.17
15.0%
3,578
3,733
3,917
15.0%
26.33
28.82
16.0%
3,372
3,501
3,651
16.0%
24.81
26.86
17.0%
3,194
3,302
3,426
17.0%
23.50
25.21
18.0%
3,038
3,129
3,234
18.0%
22.35
23.80
Source: Company projections; Assumes total debt of US$200mm, cash of US$901mm (cash and cash equivalents of US$492mm, restricted cash of US$198mm, and short-term investment of US$211mm)
(as of Sep 30, 2012) and diluted ADS o/s; equity value adjusted for FMCN's 15% stake in VisionChina as of Dec 17, 2012
WACC
Dec-17 Terminal year
886
824
104
179
(105)
(108)
(248)
(231)
(174)
(179)
(62)
(64)
401
Terminal growth
3.0%
29.49
27.47
25.76
24.29
23.03
2.0%
422
J.P.MorganView entire presentation