BigCommerce Results Presentation Deck
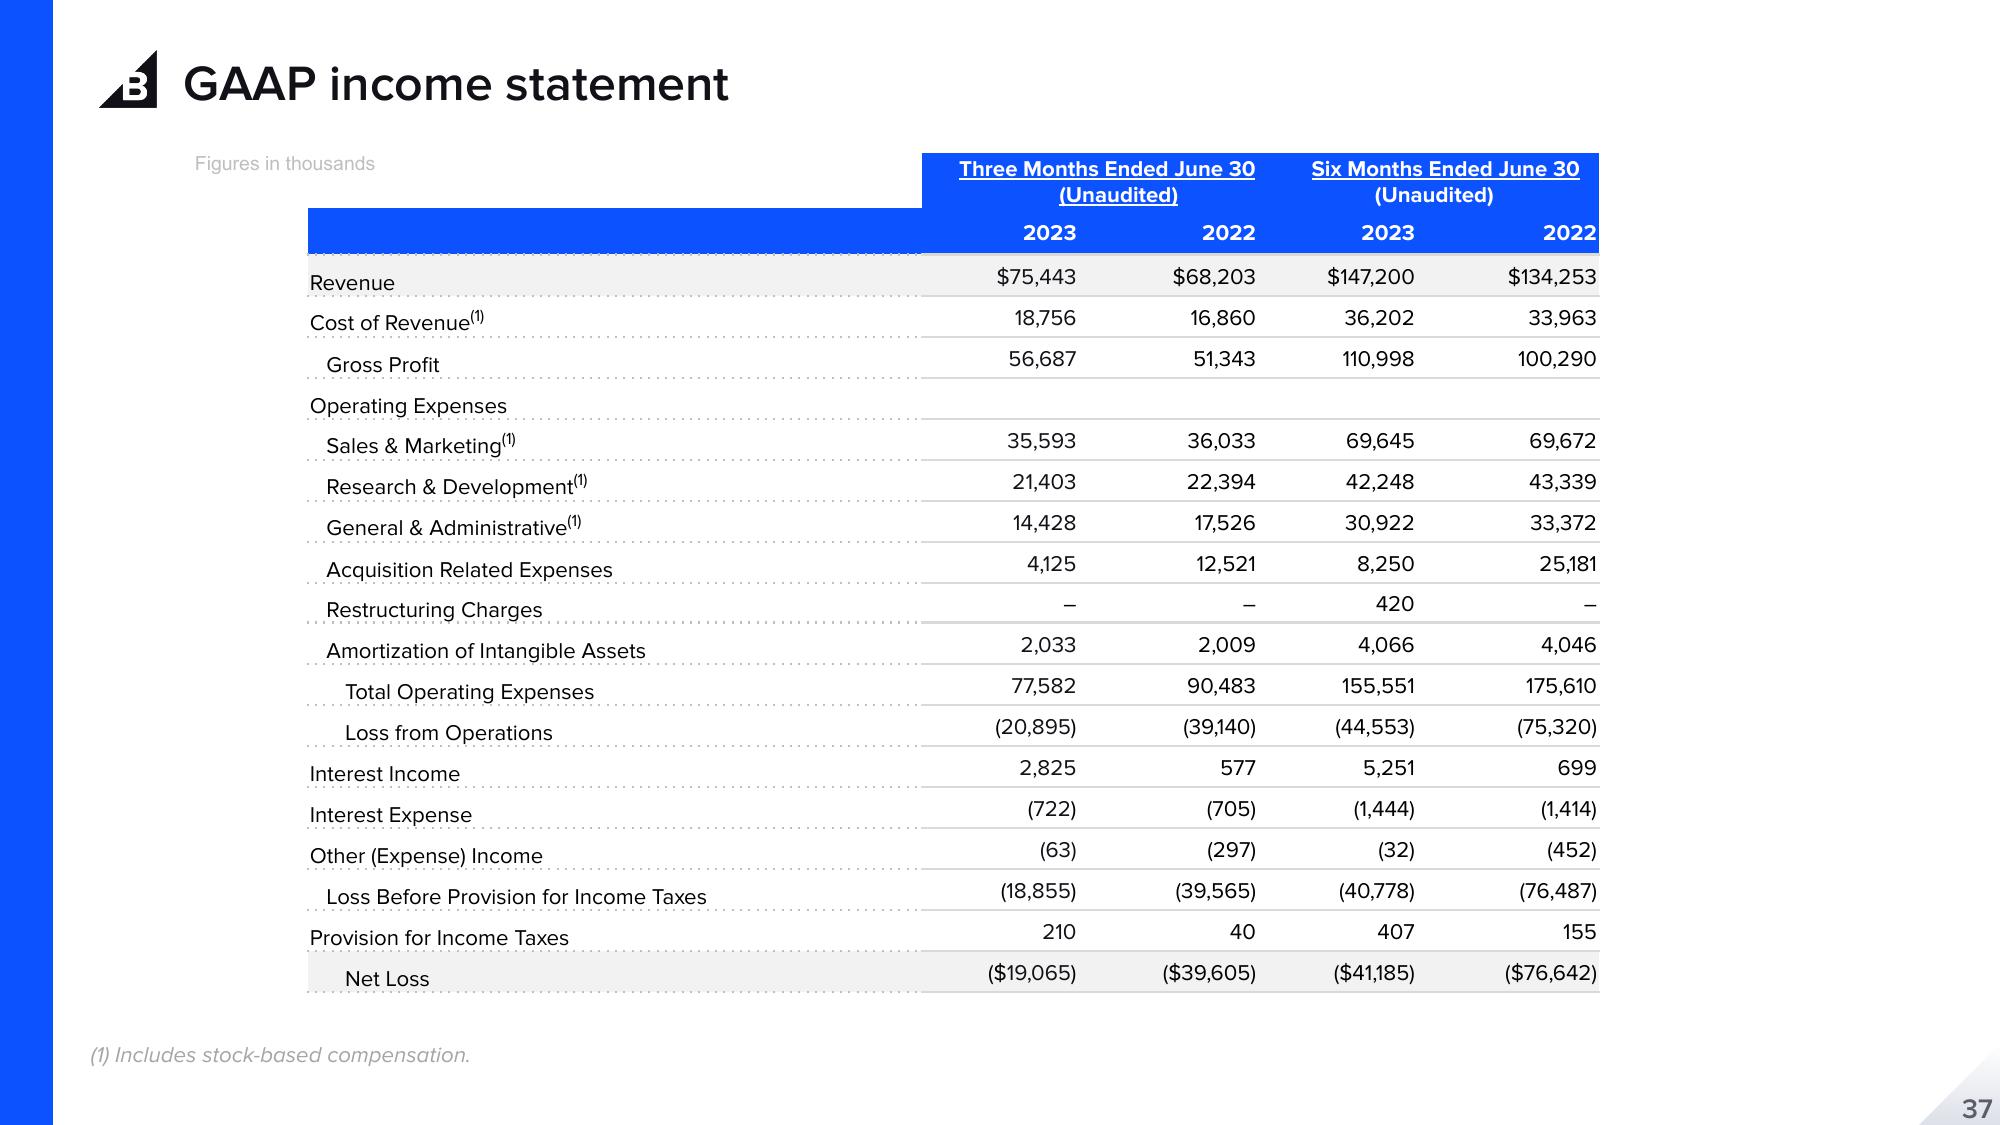
GAAP income statement
Figures in thousands
Revenue
Cost of Revenue (¹)
Gross Profit
Operating Expenses
Sales & Marketing (1)
Research & Development (¹)
General & Administrative(1)
Acquisition Related Expenses
Restructuring Charges
Amortization of Intangible Assets
Total Operating Expenses
Loss from Operations
Interest Income
Interest Expense
Other (Expense) Income
Loss Before Provision for Income Taxes
Provision for Income Taxes
Net Loss
(1) Includes stock-based compensation.
Three Months Ended June 30
(Unaudited)
2023
$75,443
18,756
56,687
35,593
21,403
14,428
4,125
2,033
77,582
(20,895)
2,825
(722)
(63)
(18,855)
210
($19,065)
2022
$68,203
16,860
51,343
36,033
22,394
17,526
12,521
2,009
90,483
(39,140)
577
(705)
(297)
(39,565)
40
($39,605)
Six Months Ended June 30
(Unaudited)
2023
$147,200
36,202
110,998
69,645
42,248
30,922
8,250
420
4,066
155,551
(44,553)
5,251
(1,444)
(32)
(40,778)
407
($41,185)
2022
$134,253
33,963
100,290
69,672
43,339
33,372
25,181
4,046
175,610
(75,320)
699
(1,414)
(452)
(76,487)
155
($76,642)
37View entire presentation